Have a Question ?

Expert Answers

Search solutions for your assignments from our database.
We have 20+ millions solutions for question that will help you improve your grades

1

(Solved): WPC 300 - Quiz 2 Questions...


Question 1

Standard deviation of a normal data distribution is a ___________________

  •   Measure of data quality 
  •   Measure of data centrality 
  •   Measure of data shape 
  •   Measure of data dispersion

Question 2

Which of the following is true about A/B testing?

  •   To increase conversion rate of your website traffic, A/B testing can be beneficial.
  •   You should test multiple elements of your landing page at a time and compare
  •   A neutral result on an A/B testing means you correctly performed the test
  •    You need to attend WPC 300 course to learn about A/B Testing

Question 3

In the experimental design example "IQ Water", students are called  

  •   Experimental units 
  •   Treatments 
  •   Measurement units 
  •   Response variable 

Question 4

A researcher wants to find out if lack of exercise leads to weight gain. Which of the following variables could be considered as a confounder?  

  •   Time of exercise
  •   Age 
  •   Exercise level 
  •   Weight

Question 5

In inferential statistics, a _____________ is used to infer about a ______________.

  •   Population, sample
  •  Sample, population
  •   Sample, significance
  •   Population, significance 

Question 6

Regular consumptions of organic food will keep you in a good mood. In this example, the confounder could be  

  •   Money
  •  organic food
  •   people's mood
  •  work ethics

Question 7

What are the three principles of describing data?

  •   center, spread and shape
  •   Centrality, dispersion and size
  •   Dispersion, range and standard deviation
  •   Mean, median and mode

Question 8

For a normal distribution mean is _____________  median.

  •   sometime equal to
  •   Greater than
  • Less than
  •  Closely equal to

Question 9

When two variables are highly positively correlated, the correlation coefficient will be ______________

  •   Close to 0
  •  Close to -1
  •   Close to 1
  •  Close to 10

Question 10

What is the first step of running an A/B testing to improve website visits?

Hint: What do you do in any experimental design, in this case, design for A/B testing?

  •   Making assumptions about the behavior of the visitors to the site
  •   Establishing your success metric to improve site visits
  •   Establishing the conversion rate from the site visit
  •   Creating three variations for your landing page elements


View Buy Answer $15 Sign In -- OR --

1

(Solved): WPC300-33872 Assignments: HOA-new-2...


WPC 300 : HOA-2 : Case - Medical Malpractice

AUG 2020 UPDATE is now ready see it here


WPC300-33872 Assignments: HOA-new-2

Case - Medical Malpractice:
Descriptive Statistics, Graphics, and
Exploratory Data Analysis


Assignment instruction:
You must install JMP pro on your computer before attempting this assignment. You must use the data file: MedicalMalpractice.JMP.
Read the case very carefully and answer the questions (fill in the blanks) when necessary. The questions are colored in "red". In addition, you must reproduce all the figures by following the instructions provided in the case.


Deliverable:
Create a word document and answer all the questions and attach the screen shot of all the figures in the case (Exhibit-1 to 11). The first page of your document must have your full name and student ID.

Analysis
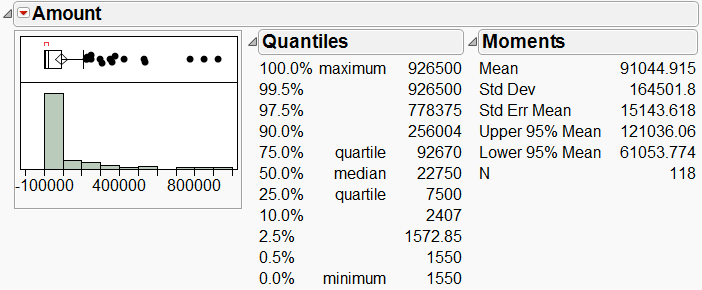
We begin by looking at the key variable of interest, the amount of claim payment. Exhibit 1 displays a histogram and summary statistics for Amount.
Exhibit 1 Distribution of Amount
(Analyze > Distribution; Select Amount as Y, Columns, and click OK. For a horizontal layout select Stack under the top red
triangle.)
From Exhibit 1 we see that the histogram of Amount is skewed right, meaning that there is a long tail,
with several very high payments. The mean (average) payment is _______ while the median (middle) is
___________. When a histogram is right skewed, as is the case here, the mean will exceed the
median. This is because the mean is influenced by extreme values – the high payments that we
observe in the histogram inflate the mean.
A measure of the spread of the data is the standard deviation (StdDev in Exhibit 1). The higher the
standard deviation, the larger the spread, or variation, in the data. When the data are skewed, the
standard deviation, like the mean, will be inflated.
Other useful summary statistics are the quartiles. The first quartile (next to 25.0% in Exhibit 1) is
________ and the third quartile (next to 75.0%) is __________. The interquartile range, defined as Q3 –
Q1, is a measure of the amount of spread or variability in the middle 50% of the data. This value is
displayed graphically in the outlier box plot (above the histogram). A larger version of this plot is
displayed below.
The left edge of the box is the first quartile, the center line is the median or second quartile, and the right
edge of the box is the third quartile. Hence, the width of the box is the interquartile range, or IQR.
1.5 pt
 

(Notes: The center of the diamond is the mean. We will discuss this in a few moments. The red bracket
at the top, which we won’t discuss further, denotes the “densest” region of the data.)
The outlier box plot helps us to visually identify potential outliers. The rule of thumb used to distinguish
outliers from non-outliers is this: if the histogram is approximately normal, or bell-shaped, outliers are
those points that extend beyond 1.5 IQRs of the box. The line extending from the right edge of the box,
called a whisker, is roughly 1.5 IQRs in length (we say “roughly”, because it is actually drawn to the
furthest point within that range, so it may not be quite 1.5 IQRs).
Let’s ignore, for sake of illustration, the fact that our data are right skewed. There are 16 points beyond
the whisker, which we will consider to be outliers. In this case, the outliers are those points that are much
larger than the rest.
Having identified several outliers, what should we do about them? Let’s consider removing them from the
analysis. To do so, we will hide and exclude the points (rather than simply deleting them). Hide removes
points from graphs, while Exclude removes them from future calculations.
Exhibit 2 is the new histogram for Amount after excluding and hiding the 16 outliers.
Exhibit 2 Amount after excluding and hiding 16 outliers
(To exclude and hide, draw a box around the points in the
boxplot to select them. Then, select Rows > Hide and
Exclude. Return to Analyze > Distribution and re-generate
the histogram.)
Note that there are now seven (7) new outliers! We might as well get rid of those seven outliers as well.
The result is shown in Exhibit 3.
Exhibit 3 Amount after excluding and hiding a total 23 outliers
OK, so now we have six more outliers. How long can this game go on? You’re welcome to continue
excluding and hiding outliers as you see fit. Or perhaps you’ve gotten the message: discarding outliers
1.5 pt


View Buy Answer $15 Sign In -- OR --

1

(Solved): Discussion 2: Project descriptions provide the following de...


Discussion 2:

Project descriptions provide the following details:

  • The problem the project will address.
  • A set of goals for the project.
  • The overall objectives for the project.
  • A project plan that describes the activities the members will undertake.

The project description also includes the location of the project, the length of the project, and any benefits you will receive while serving on the project.

Strictly based on your current knowledge:

  • What data items are needed to account for the expectations?
  • Explain why these expectations must be addressed.

The intent is to begin thinking about your upcoming Capstone project.


View Buy Answer $15 Sign In -- OR --

1

(Solved): Discussion Question: Select one of the case studies related ...


Discussion Question

Select one of the case studies related to a data breach at the SANS reading room.

(https://www.sans.org/reading-room/whitepapers/casestudies )

  • Briefly summarize the data breach case.
  • What cybersecurity regulations or laws were relevant in this case?
  • What threats or vulnerabilities were overlooked in the case you reviewed??
  • What security controls should the company have had in place to avoid? the breach?
  • What steps did the organization take to improve security after the breach?
  • What was the business impact of the breach??

View Buy Answer $15 Sign In -- OR --

1

(Solved): WPC300-33872 Assignments: Quiz 1...


Over-reliant on the first piece of information is called ____________

  •    Clustering illusion
  •    Bandwagon effect
  •    Anchoring bias
  •    Zero risk bias


Gamblers' fallacy is ______________

  •  Framing effect bias
  •  A clustering illusion
  •  An endowment effect bias
  •   A Zero risk bias

When you keep eating the food you don't like precisely because you already bought the food, you are committing _______________

  •    Sunk-cost fallacy
  •    Endowment effect bias
  •    Zero risk bias
  •    Availability heuristics bias


Predictive analytics may be applied to_______________, which is a set of techniques that use descriptive data and forecasts to identify the decisions most likely to result in the best performance.

  •   Descriptive analytics
  •    Forecast analytics
  •    Prescriptive analytics
  •    Explanatory analytics

Which of the following data analytics model use optimization techniques?

  •   Diagnostic analytics
  •    Descriptive analytics
  •    Predictive analytics
  •    Prescriptive analytics

Which of the following is an example of secondary data?

  •   Firm's proprietary data
  •   Simulated data
  •    Interviews data
  •    Survey data

Which of the following statements is true?

  •   Using intuition is a way of analytical thinking  
  •   Experimentation is a way of analytical thinking
  •   Analytical thinking is not based on facts
  •   Heuristic thinking is slow

In an agile approach of analytics what is the first step of the process?

  •   Score and deploy
  •   Perform business discovery
  •    Perform data discovery
  •    Model data

What are the four types of data analytical method?

  •   Descriptive, analytical, predictive and prescriptive
  •    Critical, analytical, predictive and explanatory
  •    Descriptive, explanatory, predictive and prescriptive
  •    Descriptive, logical, predictive and prescriptive

In an ETL process, data is loaded into a final target database such as:

  •   Public database
  •    Data warehouse
  •    Operational dashboard
  •    Social media database


View Buy Answer $15 Sign In -- OR --

1

(Solved): Contemporary Cross-Cultural Literature: Week 1: Introductory...


Why is an understanding of cross-cultural literature important to you?  Or why should it be important? 

Upload a picture of yourself.

Once you've done that, please read and respond to the introductions posted by at least 5 of your classmates.

If a student has already received 3 or more responses, please move on to someone else.

Reply to all of the responses you receive.


View Buy Answer $15 Sign In -- OR --

1

(Solved): Hands on Assignment-1: Analyzing Data using Pivot Tables (To...


Hands-on Assignment-1
Analyzing Data using Pivot Tables
Total points 25

You’ve been asked to help better understand sales patterns in DS’s Fine Foods Emporium. And you will use the dimensional data set “Food Emporium.xlsx” They sell a variety of fine products, such as Gustaf's Knäckebröd, Pâté Chinois, and Maxilaku. Their motto is “Food so good even we don’t know what it is!”

Specifically, you’ve been asked to answer a series of questions, which are listed in the table below. You will perform the quantitative analysis to answer each of these questions. They can all be answered by constructing pivot tables and pivot charts in Excel. The Excel spreadsheet “Food Emporium.xlsx” has already been created for you. This is the single-table, joined data cube and is ready for analysis.

Evaluation Criteria:
Your submission will be graded based on whether the answers provided for each question are correct with supporting excel file. Create one sheet per question and name each sheet as Q1, Q2 etc. for Question 1, Question 2 etc.


Questions [Maximum possible points: 25]

  1. What are the five best-selling products based on quantity sold? [2 pt.]
  2. What are the five worst selling products based on quantity sold? [2 pt.]
  3. What’s the average extended price by order? [2 pt.] (HINT: Look at the extended price by order and then use “value field setting” to change to AVERAGE function)
  4. What is the average quantity sold per order? [3 pt.] (HINT: Look at the total quantity by order and then use “value field setting” to change to AVERAGE function)
  5.  Are our sales seasonal (look at total sales in dollars)? Explain. [3 pt.]
  6.  Based on the data we have, does our discount policy appear to help sales? HINT: You need to compare the average discount and average $ sales across product lines.[3 pt.]
  7.  What are the five most heavily discounted products? [2 pt.]
  8.  Who are our five best customers based on total sales (i.e., Extended Price)? [2 pt.]
  9. What are the five most popular (quantity sold) products among our five best customers? (HINT: Apply a filter to include only the five best customers found in #8) [2 pt.]
  10. Create a pi-chart to demonstrate the average discount enjoyed by each customer segment? [ 2 pt.]
  11. Demonstrate (use a line graph) to show how total sales revenue (extended price) change for each State (customer State) [2 pt.]


View Buy Answer $15 Sign In -- OR --

1

(Solved): Threats, vulnerabilities, and risks across the seven domains...


Identify basic threats, vulnerabilities, and risks across the seven domains of IT infrastructure.

Align the identified risks, threats, and vulnerabilities to each of the seven domains of a typical IT infrastructure.

Describe how identified risks can impact each of the seven domains of an IT infrastructure.

Determine which of the domains of an IT infrastructure is most impacted by an identified risk, threat, or vulnerability.


View Buy Answer $15 Sign In -- OR --

1

(Solved): List the seven domains of IT infrastructure. Select one doma...


Discussion:

In this discussion, we examine the seven domains of IT Infrastructure and their related potential threats and vulnerabilities. Generally speaking, these threats and vulnerabilities are composed of two types—those caused by people (such as embezzlement and fraud), and those caused by technology (such as phishing, pharming, and phreaking).

Discussion Question

List the seven domains of IT infrastructure. Select one domain answer the following questions.

  1. What is possible threat to this domain?
  2. How could this threat exploit potential vulnerabilities or weaknesses in this domain?
  3. How could the resulting exploit impact an organization?


View Buy Answer $15 Sign In -- OR --

1

(Solved): Web Design assignment : A. Identify the purpose and types of...


The assignment for website:

The report we are asked to write about the following points in details:

  1. Identify the purpose and types of DNS, including explanations on how domain names are organized and managed.
  2. Explain the purpose and relationships between communication protocols, server hardware, operating systems and web server software with regards to designing, publishing and accessing a website.
  3. Evaluate the impact of common web development technologies and frameworks with regards to website design, functionality and management.
  4. Review the influence of search engines on website performance and provide evidence-based support for improving a site’s index value and rank through search.
  5. Discuss the capabilities and relationships between front-end and back-end website technologies and explain how these relate to presentation and application layers.
  6. Discuss the differences between online website creation tools and custom built sites with regards to design flexibility, performance, functionality, User Experience (UX) and User Interface (UI).
  7. Evaluate a range of tools and techniques available to design and develop a custom built website.
  8. Justify the tools and techniques chosen to realise a custom built. (bootstrap theme was used).


You are expected to use appropriate references throughout and keep carefully detailed notes of all your sources of materials for material you have used in your work, including any material downloaded from the Internet


View Buy Answer $15 Sign In -- OR --

Showing Page 141 of 154 Pages