(Solved): WPC 300 : HOA-2 : Case - Medical Malpractice : Descriptive Statistics, Graphics, and Exploratory Data Analysis-updated SCORE 100%...

WPC 300
Assignment: Medical Malpractice
AUG 2020 UPDATE

Background
According to a recent study published in the US News and World Report the cost of medical malpractice in the United States is $55.6 billion a year, which is 2.4 percent of annual health-care spending. Another 2011 study published in the New England Journal of Medicine revealed that annually, during the period 1991 to 2005, 7.4% of all physicians licensed in the US had a malpractice claim. These staggering numbers not only contribute to the high cost of health care, the size of successful malpractice claims also contributes to high premiums for medical malpractice insurance.
An insurance company wants to develop a better understanding of its claims paid out for medical malpractice lawsuits. Its records show claim payment amounts, as well as information about the presiding physician and the claimant for a number of recently adjudicated or settled lawsuits.
The Analysis
Using descriptive statistics and graphical displays, explore claim payment amounts, and identify factors that appear to influence the amount of the payment.
The Data: MedicalMalpractice.jmp
The data set contains information about the last 118 claim payments made, covering a six-month period. The eight variables in the data table are described below:
- Amount: Amount of the claim payment in dollars
- Severity: The severity rating of damage to the patient, from 1 (emotional trauma) to 9 (death)
- Age: Age of the claimant in years
- Private Attorney: Whether the claimant was represented by a private attorney
- Marital Status: Marital status of the claimant
- Specialty: Specialty of the physician involved in the lawsuit
- Insurance: Type of medical insurance carried by the patient
- Gender: Patient Gender
The variables are coded in JMP with a Continuous, Ordinal or Nominal modeling type. This coding helps to make sure that JMP performs the correct analysis and produces appropriate graphs. A first step in any analysis is to ensure that your variables have the correct Modeling Type:
- Continuous variables, like Amount, have numeric values (e.g.; 2, 5, 3.35, 159.667,...).
- Ordinal variables, such as Severity, have either numeric or character values which represent ordered categories (e.g., small, medium, and large; 1-9 severity rating scales, ...).
- Nominal variables, like Gender, can also have either numeric or character values, and represent unordered categories or labels (e.g., the names of states, colors of M&Ms, machine numbers, ...).
Remember: As you are analyzing the data, store the sequence of events in a script in the data file and save that data file once the analysis is complete.
Question 1 3 pts
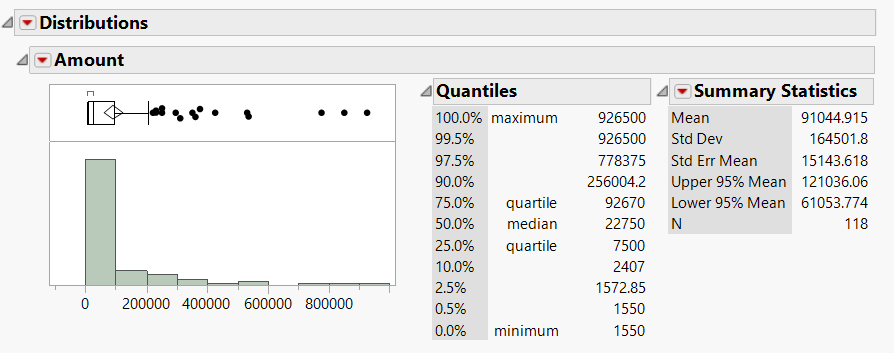
What is the average amount of claim paid out for medical malpractice lawsuit?
- $91045
- $6053
- $12036
- $16450
Question 2 3 pts
What is the average age of female claimant in the data over the years?
- 42.83
- 40.81
- 39.54
- 45.87
Question 3 3 pts
Create a frequency distribution (in percent) of types of insurance carried by the patient? Submit the screenshot
Upload Choose a File
Question 4 3 pts
Which of the following statements is true about the claim amount?
Average claim amount for males is higher than that of females
Average claim amount for females is higher than that of males
None of the other statements are true
Average claim amounts for both males and females are about the same
Question 5 3 pts
In an average, the highest amount of claim was paid out for specialty of physicians. (Hint: use graph builder to compare)
- Pathology
- Dermatology
- Pediatrics
- Radiology
Question 6 3 pts
You will investigate whether payment amounts are related to whether or not a private attorney represented the claimant.
Hint: Analyze > Fit Y by X; use Private Attorney as X, Factor and Amount as Y, Response. Then, select Quantiles under the top red triangle
What is your conclusion?
- Amount of the claim payment had a lot to do with whether a private attorney was used.
- Average claim is lower when a private attorney was used
- Amount of claim payment had nothing to do with whether a private attorney was used.
- Nothing can be concluded based on the available information
Question 7 3 pts
Provide a screenshot of your analysis to support your answer for Question 6.
Upload Choose a File
Question 8 3 pts
You want to know if relationship between Private Attorney and Amount is consistent for females and males.
Hint: Graph > Graph Builder; Drag and drop Amount in Y, Gender in X, and Private Attorney in Group X. Click on the box plot icon at the top. Or, right-click in the graph and select Points > Change to > Box Plot.
What is your conclusion?
- If a private attorney was used the payout was generally lower for male and higher for female patients
- If a private attorney was used the payout was generally higher for male and lower for female patients
- If a private attorney was used the payout was generally lower for both male and female patients
- If a private attorney was used the payout was generally higher for both male and female patients.
Question 9 3 pts
Based on the severity rating of damage to the patient, the mean amount paid to the patient with emotional trauma was:
- $390436
- $7500
- None of the answer selections are correct
- $28418
Question 10 3 pts
Submit the JMP data file with saved script for all the analysis to answer each question of this assignment.
Upload
Choose a File
Expert Answer

Buy This Answer $15
-- OR --
Subscribe $20 / Month
