
(Solved): WPC300 Quiz 3: Descriptive : Scored 10 out of 10...
WPC300
Quiz 3: Descriptive
Scored 10 out of 10
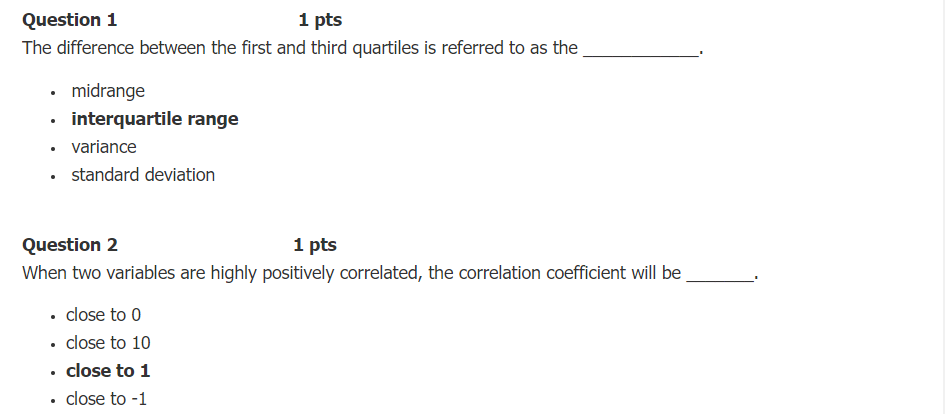
Question 1 1 pts
The difference between the first and third quartiles is referred to as the ____________.
- midrange
- interquartile range
- variance
- standard deviation
Question 2 1 pts
When two variables are highly positively correlated, the correlation coefficient will be _______.
- close to 0
- close to 10
- close to 1
- close to -1
Question 3 1 pts
According to statistical notation, what does ∑ stand for?
- to represent sample statistics
- to act as a summation operator
- to represent the number of items in a population
- to represent population measure
Question 4 1 pts
What are the three principles of describing data?
- Centrality, dispersion and size
- Dispersion, range and standard deviation
- Mean, median and mode
- Center, spread and shape
Question 5 1 pts
For a normal distribution mean is _______ to median.
- greater than
- equal
- less than
- not equal
Question 6 1 pts
Which of the following is an example of a sample?
- The population of Canada
- The number of individuals who have a Ford car
- The number of members in the Democratic party
- The number of IT employees out of all employees working in an office of Google
Question 7 1 pts
Which of the following describes the standard deviation?
- It is the average of the greatest and least values in the data set.
- It is the square root of the variance.
- It is the difference between the first and third quartiles of a data set.
- It is the square of variance
Question 8 1 pts
Standard deviation of a normal data distribution is a _______.
- measure of data centrality
- measure of data dispersion
- measure of data shape
- measure of data quality
Question 9 1 pts
Which of the following is an example of a measure of dispersion?
- mean
- mode
- variance
- median
Question 10 1 pts
The ________ is the observation that occurs most frequently.
- mean
- mode
- outlier
- median
Expert Answer
Buy This Answer $15
-- OR --
Subscribe $20 / Month