
(Solved): WPC 300 (Hybrid Course) Assignment 10...

WPC 300 (Hybrid Course)
Assignment-10
Maximum points: 25
Student Name: _[Mary Alfansha ]___________________ Class Day & Time:__[Monday & 9.15 AM]_
Follow the steps outlined to reproduce all the graphs using Tableau and answer the questions below. You must attach the screenshot of your work to support your conclusion.
1. Revenue by Team
Question: What is the highest revenue? (Include the team name in your answer)
Answer: Team ____ had the highest revenue. The revenue was ___________ Euro [ 1.25 + 1.25 pts]
2. Revenue by Product
Question: What product had the highest revenue? (Include the revenue amount in your answer)
Answer: _____________ Muesli had the highest revenue. The revenue was ___________. [1.25+1.25 pts]
3. Revenue by Team and Round
Question: Display the trend of revenue over rounds for each team. Which team has the largest difference (highest point – lowest point) in revenue across multiple rounds.
Answer: Team ___ (from round ___ to round ___, the difference is: ____________ Euro) [1.25+1.25 pts]
4. Revenue by Team and Product
Question: Observe the market share of each team by product (show only the graph). Name the teams that don’t have any revenue in five or more product categories?
Answer:
Teams that have no revenue in five or more product categories are: _______________ [2.5 pts.]
5. Revenue by Distribution Channel and Product
Question: Are there any products that don’t sell in specific distribution channels? If so, then list the products along with their respective distribution channel.
Answer: Distribution Channel 10: [1 pts]
Distribution Channel 12: [0.5 pts] Distribution Channel 14: [1 pts]
6. Price by Product and Team
Question: What were the highest prices paid for a Muesli product for each team? Which team paid the most towards all the Muesli product bought? (Include the product name and price in your answers)
Answer: [2.5 pts]
( Example -> NN: Product Name: €Price) NN:
OO:
KK:
SS:
RR:
TT:
QQ:
PP:
LL:
MM:
_________ paid the most for all the Muesli products bought by a team - €_______
7. Quantity by Team and Product
Question: Which team sold the most quantity of muesli? For that team, what was the most sold product? (Include the quantities in your answers)
Answer:
Team ___ sold the most quantity of muesli. A total of _____________ [1.25 pts]
For the team ___, _____________ Muesli was the most sold product – a total of _______ [1.25 pts]
8. Revenue and Price by Product
Question: What product has highest price and highest revenue? (Include the price and revenue amount in your answer)
Answer: _________________ Muesli, Price: _______, Revenue: _____________ [2.5 pts]
9. Highest Revenue on a day
Question: Overall, What team made the highest revenue in a single round? (Include the exact Day, Round, and Revenue amount in your answer)
Answer: Team ____ has the highest revenue (€_____________) on Day ___ Round ___. [2.5 pts]
10. Highest revenue for a product on a single day
Question: What product on what day and round brought the highest revenue? (Include the team name and revenue amount in your answer)
Answer: Day: ____
Round: ______
Product: ____________
Team: ____
Revenue: _______________
[0.5 X 5 = 2.5 pts]
Expert Answer
NOTE: After purchase, you will receive a zip file with the two files as an attachment to the email you register when purchasing.
Follow the steps outlined to reproduce all the graphs using Tableau and answer the questions below. You must attach the screenshot of your work to support your conclusion.
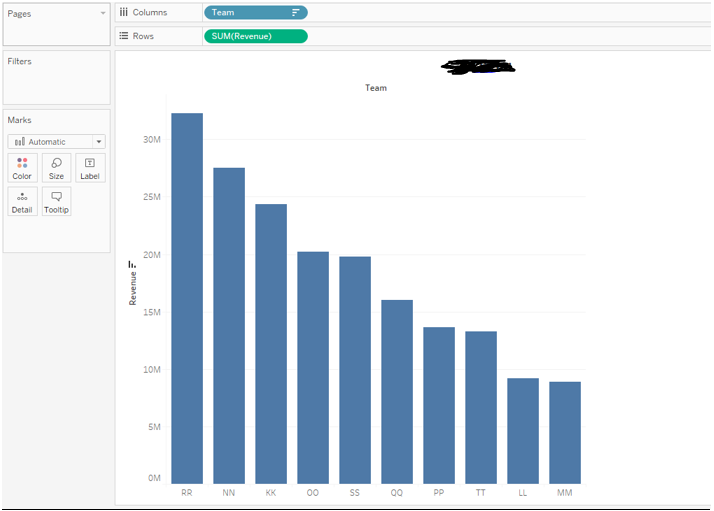
1. Revenue by Team
Question: What is the highest revenue? (Include the team name in your answer)
Answer: Team _RR___ had the highest revenue. The revenue was 32,297,798 Euro
Hint: Use a column chart. From Measures, drag Revenue into Rows, from Dimensions, drag Team into Column. Click on the icon (right under “Window” tab to change Sort of revenue to descending.
Buy This Answer $15
-- OR --
Subscribe $20 / Month