(Solved): WPC 300 Homework Assignment HOA-6 Tableau Exercise(both files)...
Tableau Exercise
HoA-6
Dr. Asish Satpathy
WPC 300 : Assignment 3 Tableau Data Visualization
Sept 2020 UPDATE is here
The ERPSim game is played by teams over several rounds (up to 8 rounds of 30 virtual days each). They sell up to six products at a time from a possible 12 products that the market consumes. The products are all muesli cereal2 in various flavors and box sizes. The teams must forecast demand, run MRP, procure, produce, price and market their products for sale.
Figure 1 shows the entire cash to cash cycle in the game. The transactions in bold are decision points that teams must make and execute. They are considered strategic in nature. The transactions that are gray are considered operational in nature. They are automated by the simulator. Additionally, teams can run analytical reports at various points in the game to monitor and strategize.
Data from an actual game have been extracted from SAP ERP and stored in an Access database. Then queries have been written to report important findings. The results have been exported to Excel.
You will use Tableau to acquire ERPSim data and visualize to discover any interesting trends.
Deliverable:
- A word file with answers and proper screen shots from Tableau to show how you got the answer. Name the word file as your FirstName_LastName _HOA#6.docx
- The Tableau file that shows sheets for different questions. Make sure you print your name on each page of the data visualization sheet.
2 http://en.wikipedia.org/wiki/Muesli
1. Launch Tableau on your desktop [You must get a valid license to access Tableau].
2. Open Sales data.xlsx as shown below.
3. Go to worksheet.
4. Click on different Dimensions and Measures to see the possible visualization format on the right.
a. What is a measure? A measure is a field on which calculations can be made. These are fields of business interest for analytics. e.g. revenue, profit, quantity sold. The calculations can sum, min, max, average, count etc. Measures are also called key figures or facts.
b. What is a dimension? A dimension is reference information about a measure. It provides context for the measures. E.g. customer, time, product. Revenue by customer is an example of how you would report a measure by a dimension.
5. Explore various panels and tools.
6. We are now ready to manipulate and visualize this data
a. Several charting options are available for visualization on the right side of the screen – bars, lines, pies, geographic, scatter/bubble, maps, radar, tag cloud etc.
b. Using the appropriate charting technique, answer the following questions. Hints are
provided for each question
EXERCISES
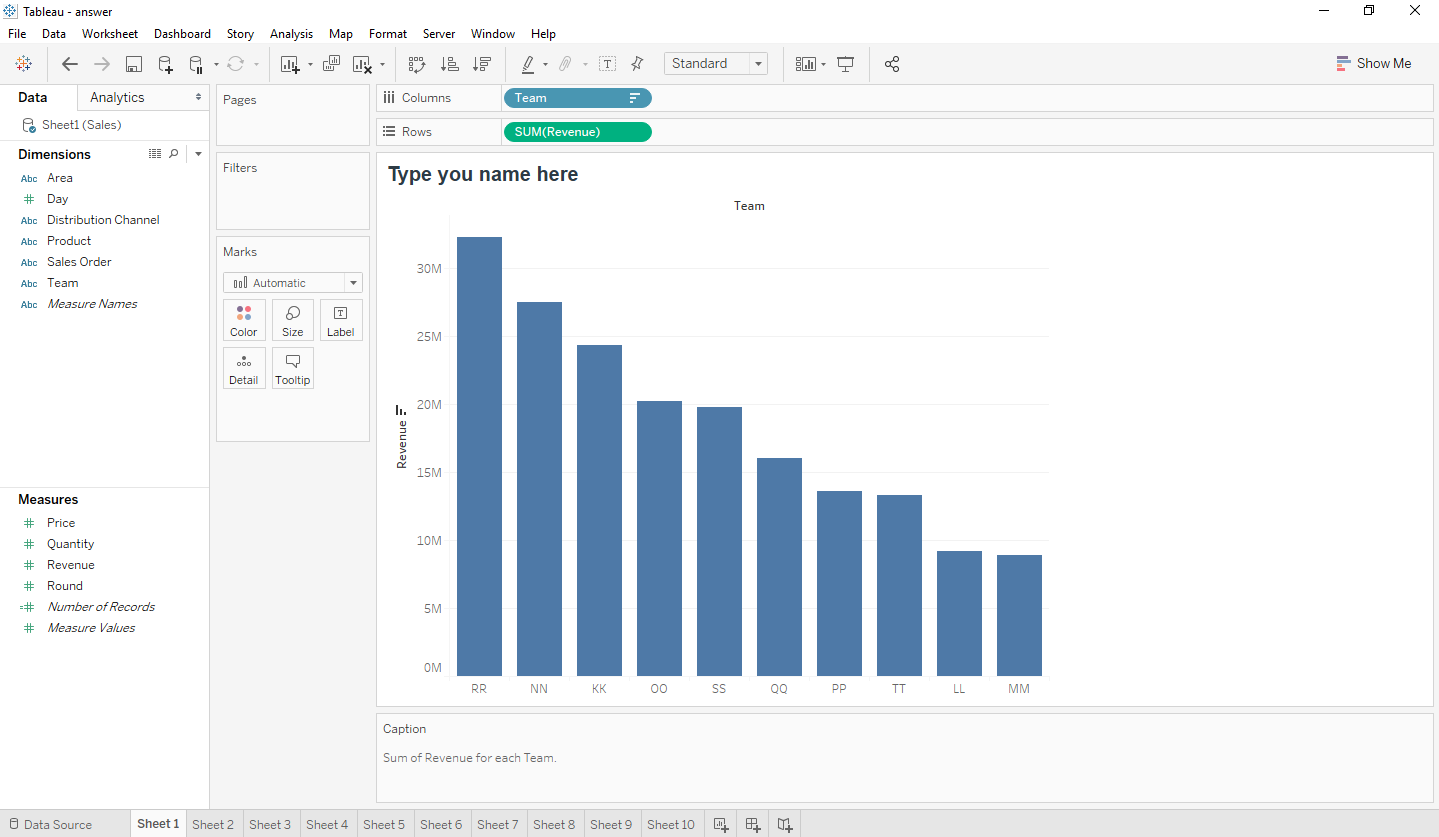
1. Revenue by Team
Question: What is the highest revenue? (Include the team name in your answer)
Answer: Team ____ had the highest revenue. The revenue was ___________ Euro
Hint: Use a column chart. From Measures, drag Revenue into Rows, from Dimensions, drag Team into Column. Click on the icon (right under “Window” tab to change Sort of revenue to descending.
2. Revenue by Product
Question: What product had the highest revenue? (Include the revenue amount in your answer)
Add a new worsksheet (at the bottom). Use a column chart. Move Revenue to Rows and Product to Column. Sort the data using the icon as before.
Answer: _____________ Muesli had the highest revenue. The revenue was ___________.
3. Revenue by Team and Round
Question: Display the trend of revenue over rounds for each team. Which team has the largest difference (highest point – lowest point) in revenue across multiple rounds.
Add a new worsksheet (at the bottom). Use a Continuous Line chart. Move Revenue to Rows and Round to Columns. Move Team to “color” tab on the left. Click the “Round” tab from the top and select “Dimension” from the pulldown. Click on “Show me” at the right corner to show the legend.
Hover your mouse curser on the line graphs to see different team and the corresponding values.
Answer: Team ___ (from round ___ to round ___, the difference is: ____________ Euro)
4. Revenue by Team and Product
Question: Observe the market share of each team by product (show only the graph). Name the teams that don’t have any revenue in five or more product categories?
Add a new worsksheet (at the bottom). Move Revenue to Rows and Product to Columns. Move Team to “color” tab on the left. Click on “Show me” at the right corner to show the legend.
Hover your mouse curser on the line graphs to see different team and the corresponding values.
Select the Team Level to find out the revenues for each team in different product category.
Answer:
Teams that have no revenue in five or more product categories are: _______________
5. Revenue by Distribution Channel and Product
Question: Are there any products that don’t sell in specific distribution channels? If so, then list the products along with their respective distribution channel.
Add a new worsksheet (at the bottom). Move Product to Rows and Distribution Channel to Columns. On Distribution Channel pull down select “Dimension”. Move Revenue to “Size” tab on the left. Click on “Show me” at the right corner to show the legend.
Answer: Distribution Channel 10:
Distribution Channel 12:
Distribution Channel 14:
6. Price by Product and Team
Question: What were the highest prices paid for a Muesli product for each team? Which team paid the most towards all the Muesli product bought? (Include the product name and price in your answers)
Add a new worsksheet (at the bottom). Move Price to Rows and Team to Columns. On Price pull down select “Continuous”. On Team pull down select “Dimension”. Move Product to “Color” tab on the left. Click on “Show me” at the right corner to show the legend. On Product pull down select “Dimension”. Click the icon (at the top of the ribbon – “Short team descending by price”.
Answer:
Example -> NN: Product Name: $Price NN:
OO:
KK:
SS:
RR:
TT:
QQ:
PP:
LL:
MM:
_________ paid the most for all the Muesli products bought by a team - $_______
7. Quantity by Team and Product
Question: Which team sold the most quantity of muesli? For that team, what was the most sold product? (Include the quantities in your answers)
Add a new worsksheet (at the bottom). Move Team to Rows and Quantity to Columns. Select Treemaps pattern to view the graph.
Answer:
Team ___ sold the most quantity of muesli. A total of _____________
For the team ___, _____________ Muesli was the most sold product – a total of ______________
8. Revenue and Price by Product
Question: What product has highest price and highest revenue? (Include the price and revenue amount in your answer)
Add a new worsksheet (at the bottom). Move Product to Rows and Price to Columns. Move Revenue to Colors. Select Packed bubble pattern to view the graph.
Answer: _________________ Muesli, Price: _______, Revenue: _____________
9. Highest Revenue on a day
Question: Overall, What team made the highest revenue in a single round? (Include the exact Day, Round, and Revenue amount in your answer)
Add a new worsksheet (at the bottom). Move Revenue to Columns and (Day) and (Team) to Columns. Move Round to Colors. From “Round” pull down, select “dimension”. Select “treemaps” graphing option. Hover your mouse curser on the biggest (area wide) tile, that will provide the answer.
Answer: Team __ has the highest revenue ($_____________) on Day ___ Round ___.
10. Highest revenue for a product on a single day
Question: What product on what day and round brought the highest revenue? (Include the team name and revenue amount in your answer)
Add a new worsksheet (at the bottom). Move Revenue to Columns and (Day), (Team) and (Round) to Columns. Move Product to Colors. From “Round” pull down, select “dimension”. Select “Tree Map” option. Once again, move Product to Colors. Hover your mouse curser on the biggest (area wide) tile, that will provide the answer.
Answer: Day: ____
Product: ____________
Team: ____
Revenue: _______________
Expert Answer
Buy This Answer $15
-- OR --
Subscribe $20 / Month
