
(Solved): WPC 300 : Final Exam DEC 2020 update...
The 2021 summer version can be obtained through this link
WPC 300 : Final Exam
DEC 2020 update
(Answer sheet contains 80 answers )
Score above 80%
Question 1
Which of the following is not a principle of problem farming
- Routinize the procedure
- Find an appropriate solution framework
- Teall an interesting and complete story
- Visualize the data
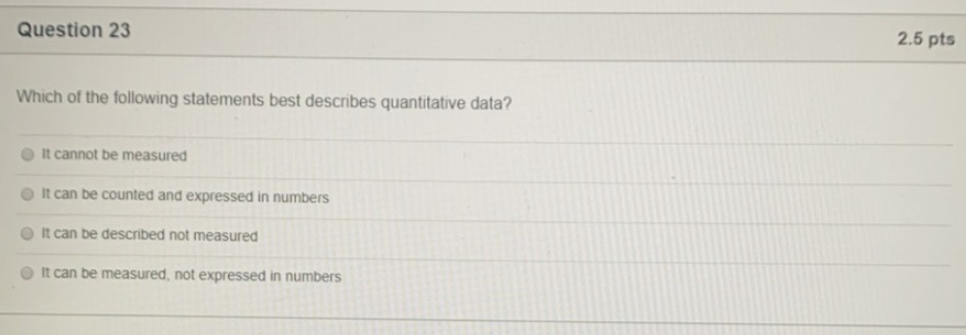
Question 2
Finding pattens in data in an example of ________ modeling
- descriptive
- prescriptive
- predictive
- explanatory
Question 3
Which of the following analytical techniques can be used to find out “which month had the highest sales year?”
- predictive
- descriptive
- prescriptive
- explanatory
Question 4
Which of the following analysis can be used to understand a causal relationship?
- predictive
- explanatory
- descriptive
- prescriptive
Question 5
The process of analytics can include
- analyze the data
- Predict an outcome
- Collect data
- All of the above selections are correct
Question 6
Analytics can be used in ________?
- Supply Chain Management
- Finance & Accounting
- Marketing
- All of the answer selections are correct
Question 7
Which of the following is not an example of data?
- Firms proprietary database
- Online survey data that we collected
- Data that has already been published
- Stock market data from a data feed
Question 8
When you are expecting a correlation between sales and profit as shown in the graph below, what kind of visualization is this?

- Spatial visualization
- Confirmation visualization
- Production visualization
- Dynamic visualization
Question 9
When the lie-factor of graphical chart is more than 1
- the graph understates the true effect
- the size of the effect shown in the graph is smaller than the actual effect in the data
- the graph suggests a possible true effect
- the size of the effect shown in the graph is bigger than the actual effect of the data
Question 10
Deleting and the grind lines in a table and the horizontal lines in a chart _____________.
- increases the data-ink ratio
- won’t make any change to the data-ink ration
- decreases the data-ink ratio
- decreases the data-ink ratio to 0.5
Question 11
Which elements is least useful in the storytelling with data?
- Visuals
- Narrative
- Sound Effects
- Data
Question 12
Adding the grind in the chart _________.
- Decreases the lie-factor
- increases the data-ink ratio
- Decreases the data-ink ratio
- Increases the lie-factor
Question 13
Which of the following statements describes one of the basic principle for creating a good chart, as defined by Edward Tufte?
- The chart should tell a story
- The chart should have a lot of ink
- The chart should display grid for easy reading
- The chart should simply stand out.
Question 14
We need to create good stories when making an analytics presentation in order to:
- Provide a surprising finish
- Get the bonus
- Creating an emotional engagement with the audience
- Know your audience
Question 15
Which of the following applies to an audience?
- Most people respond worse to visual information vs plain text
- Most of the information transmitted to the brain is not visual
- Most believe that visual content engages best on social medial
- In social medial users engage more with lengthy plain text vs video
Question 16
Fundamental principle(s) (adapted by Edward Tufte) for a vusual display of quantitative information require(s) that the chart should __________
- Tell a story
- Minimize graphical complexity
- All of the answer selections are correct
- Have a graphical integrity
Question 17
Covariance is a measure of __________
- Non-linear association between two variables x and y
- Linear association between two variables x and y which does not depend on the unit on the measurement
- Linear association between two variables x and y
- None of the answers are correct
Question 18
Which of the following is an example of a continuous variable?
- Employment classification of an employee at a restaurant
- A restaurant chosen by the diner
- The choices on a lunch menu
- The amount of time a customer waits at a restaurant before being served
Question 19
In the Phoenix area, the correlation between housing selling price and the real estate tax bill have what kind of correlation?
- Nonlinear correlation
- Negative
- Positive
- No correlation
Question 20
Which of the following is not an example of continuous data?
- Tuition
- Height
- Gender
- Revenue
Question 21
Which of the following are of interest when describing the distribution of a numerical variable ?
- Shape
- Spread
- Centrality
- AI of the answers are correct


Question 38


Expert Answer
Buy This Answer $15
-- OR --
Subscribe $20 / Month