
(Solved): 1. The Private Demand And Supply Curves For Natural Gas In New York Are Given In The Graph Below, Wh...
1. The private demand and supply curves for natural gas in New
York are given in the graph below, where Q represents millions of
cubic metres.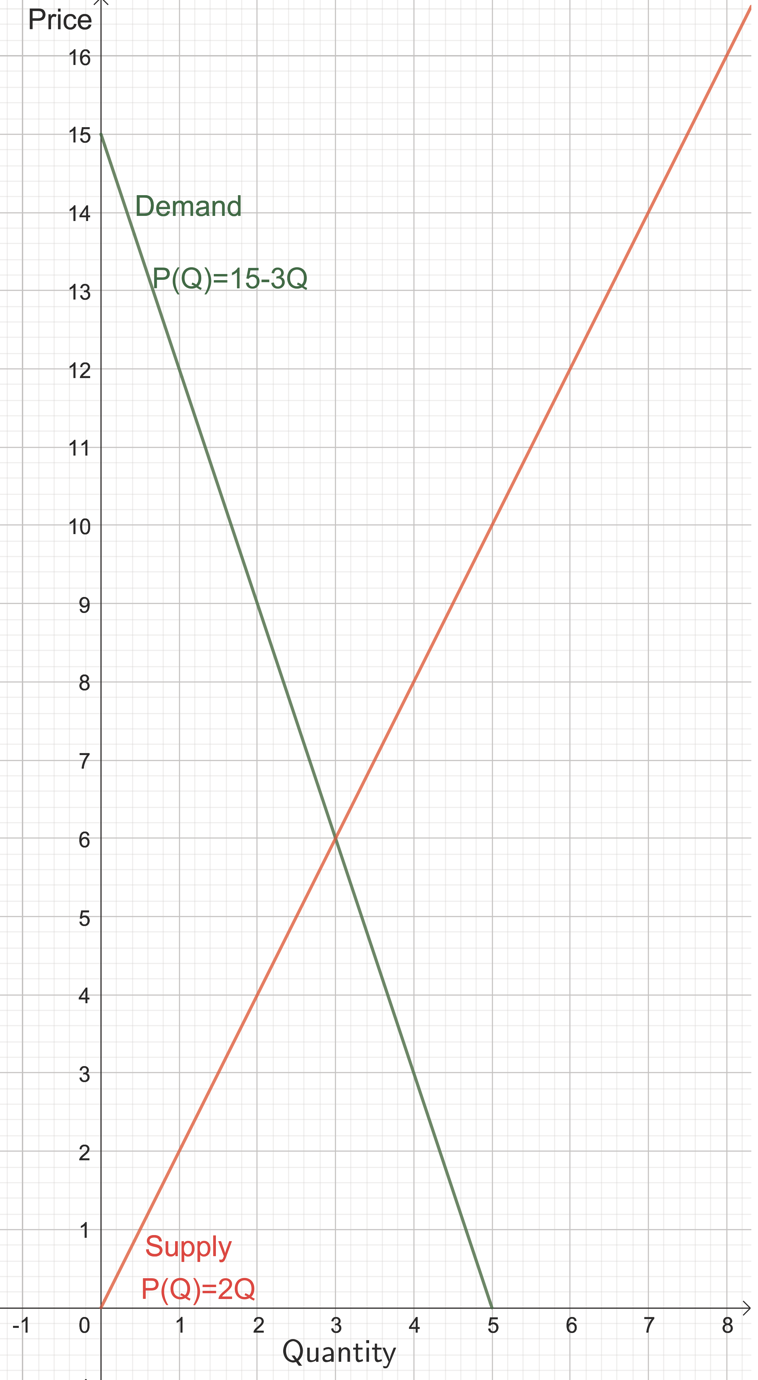
A) Suppose that burning gas produces an additional cost on New York residents valued at $2.00 per million cubic metres.
What is the socially optimal quantity of gas in New York?
B) Suppose that the burning gas produces an additional cost for New York residents valued at $2.00 per cubic metres.
In the absence of government intervention, the competitive market equilibrium will result in a deadweight loss equal to?
2. The private demand and supply curves for natural gas in New York are given in the graph below, where Q represents millions of cubic metres.
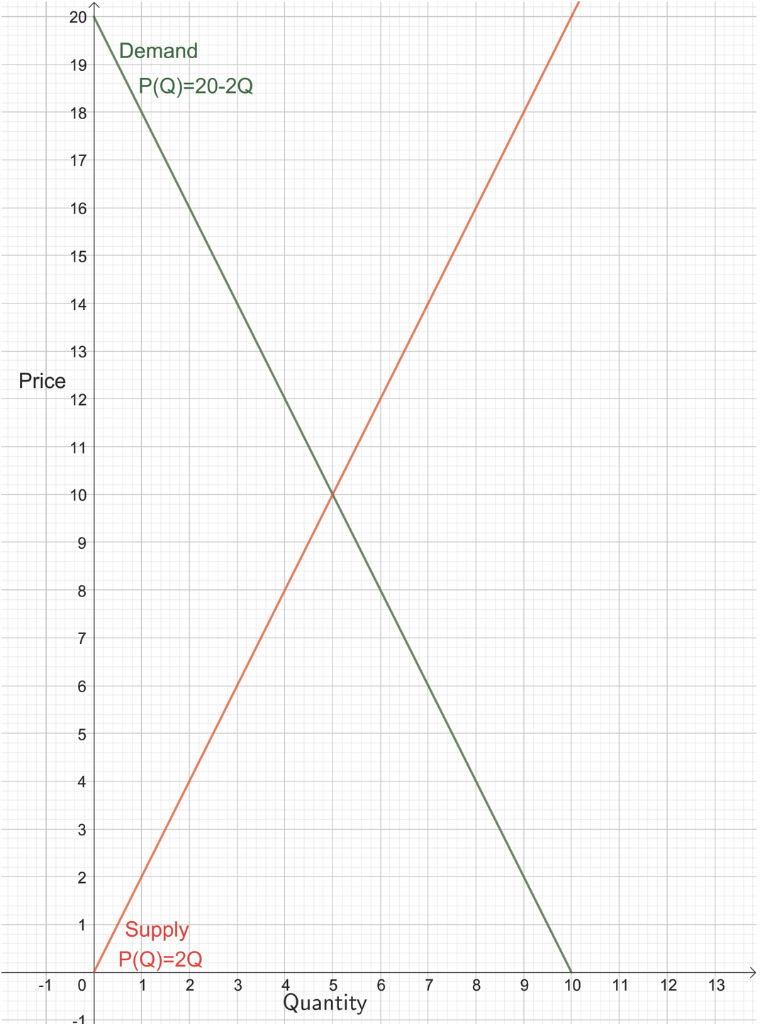
A) Suppose that the production of honey produces an additional benefit (through pollination) for New York residents valued at $3.00 per cubic metre.
In the absence of government intervention, the competitive market equilibrium will result in a deadweight loss equal to?
B) Suppose that honey produces an additional benefit (through pollination) for New York residents valued at $3.00 per million units.
What is the socially optimal quantity of honey in New York?
3. Suppose that the market demand curve for electric cars in New York is given by P = 60,000 – Q, and the market supply curve is given by P = 20,000 + 0.25Q. Further, suppose that electric cars reduce pollution on New York and this reduction in pollution is valued at $5,000 per car.
Without government intervention, the competitive market will produce ____ than the socially efficient quantity, resulting in a deadweight loss of ____.
Expert Answer
Buy This Answer $6
-- OR --
Subscribe $20 / Month