
(Solved): WPC 300 : SAS Assignment 1 Solutions...
WPC 300
SAS Assignment 1 Solutions
a. Create a new diagram named Organics.
1) Select File ðNew ðDiagram. The Create New Diagram window appears.
2) Enter Organics in the Diagram Name field.

3) Click OK.
b. Define the data set AAEM.ORGANICS as a data source for the project.
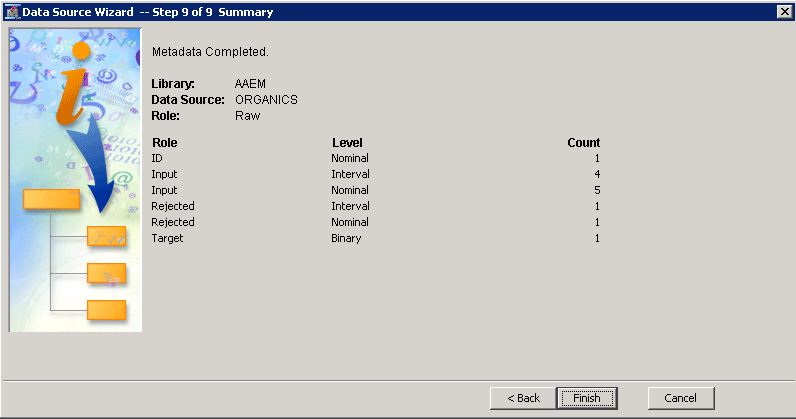
1) Set the model roles for the analysis variables.
2) Examine the distribution of the target variable. What is the proportion of individuals who purchased
organic products?
a) Select File ðNew ðData Source. The Data Source Wizard window appears.
b) Click Next. The wizard proceeds to Step 2.
c) Enter AAEM.ORGANICS in the Table field.
d) Click Next. The wizard proceeds to Step 3.

e) Click Next. The wizard proceeds to Step 4.

f) Select the Advanced radio button and click Customize. The Advanced Advisor Options window
appears.
g) Enter 2 as the Class Levels Count Threshold value.

h) Click OK. The Advanced Advisor Options window closes and you are returned to Step 4 of the
Data Source Wizard.
i) Click Next. The wizard proceeds to Step 5.
! By customizing the Advanced Metadata Advisor, most of the roles and levels are correctly
set.
j) Select Role ðRejected for TargetAmt.

k) Select TargetBuy and select Explore. The Explore window appears.

l) Close the Explore window.
3) The variable DemClusterGroup contains collapsed levels of the variable DemCluster. Presume that,
based on previous experience, you believe that DemClusterGroup is sufficient for this type of modeling
effort. Set the model role for DemCluster to Rejected.
This is already done using the Advanced Metadata Advisor. Otherwise, select RoleðRejected for
DemCluster.
4) As noted above, only TargetBuy is used for this analysis, and should have a role of Target. Can
TargetAmt be used as an input for a model used to predict TargetBuy? Why or why not?
5) Finish the Organics data source definition.
a) Click Next. The wizard proceeds to Step 6. No decision processing is required.

b) Click Next to proceed to the sample data window. No sample data is created.
c) Click Next. Leave the role of the table set to Raw.
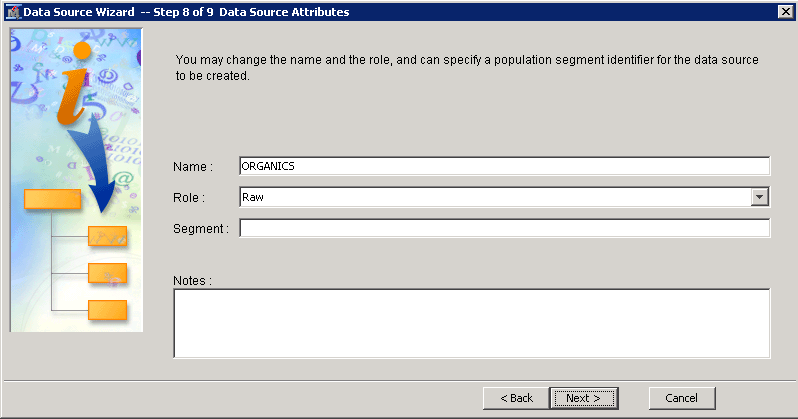
d) Click Next.
e) Click Finish. The wizard closes and the Organics data source is ready for use in the Project Panel.

c. Add the AAEM.ORGANICS data source to the Organics diagram workspace.
d. Add a Data Partition node to the diagram and connect it to the Data Source node. Assign 50% of the
data for training and 50% for validation.

1) Enter50 as the Training and Validation values under Data Set Allocations.
2) Enter 0 as the Test value.

e. Add a Decision Tree node to the workspace and connect it to the Data Partition node.

f. Create a decision tree model autonomously. Use average square error as the model assessment statistic.
• Select Average Square Error as the Assessment Measure property.

• Right-click the Decision Tree node and click Run from the Option menu.
• Click Yes in the Confirmation window.

1) How many leaves are in the optimal tree?

a) When the Decision Tree node run finishes, select Results from the Run Status window. The
Results window appears.

The easiest way to determine the number of leaves in your tree is via the Subtree Assessment plot.
b) Select View ðModel ðSubtree Assessment Plot from the Result window menu. The Iteration
Plot window appears.

Using average square error as the assessment measure results in a tree with 29 leaves.
2) Which variable was used for the first split? What were the competing splits for this first split?
! These questions are best answered using interactive training.
a) Close the Results window for the Decision Tree model.

b) Select (interactive ellipsis) from the Decision Tree node's Properties panel.
The SAS Enterprise Miner Interactive Decision Tree window appears.

c) Right-click the root node and select Split Node from the Option menu. The Split Node 1
window appears with information that answers the two questions.

g. Add a second Decision Tree node to the diagram and connect it to the Data Partition node.

1) In the Properties panel of the new Decision Tree node, change the maximum number of branches
from a node to 3 to enable three-way splits.

2) Create a decision tree model again. Use average square error as the model assessment statistic.
3) How many leaves are in the optimal tree?
h. Based on average square error, which of the decision tree models appears to be better?
1) Select the first Decision Tree node.
2) Right-click and select Results from the Option menu. The Results window appears.
3) Examine the Average Squared Error row of the Fit Statistics window.

4) Close the Results window.
5) Repeat the process for the Decision Tree (2) model.

Expert Answer
Buy This Answer $15
-- OR --
Subscribe $20 / Month