
(Solved): WPC 300 Assignment 8...

WPC 300 (Hybrid Course) Assignment-8
Maximum points: 25
Student Name: _[Mary Alfansha ] Class Day & Time: [Monday & 9.15 AM]_
The IS department of Brooks University has been collecting data for last few years of their applicants pool for the “Masters In Business Analytics” program who eventually got admitted to the program. The data variables in the file “SchoolAdmission.jmp” constitutes the following information.
|
ADMIT |
1 if the individual was admitted to the graduate school and 0 otherwise. |
|
GRE |
GRE (Graduate Record Examination) Score received by the applicant |
|
GPA |
Undergraduate GPA scored by the applicant |
|
RANK |
Rank of the undergraduate school, Institutions with a rank of 1 have the highest prestige, while those with a rank of 4 have the lowest. |
You have been tasked to develop a model to predict candidate’s admission to the program that the school could potentially use to develop a new recruitment campaign. The school understands that targeting the right students would result in saving money in their marketing endeavor.
Questions:
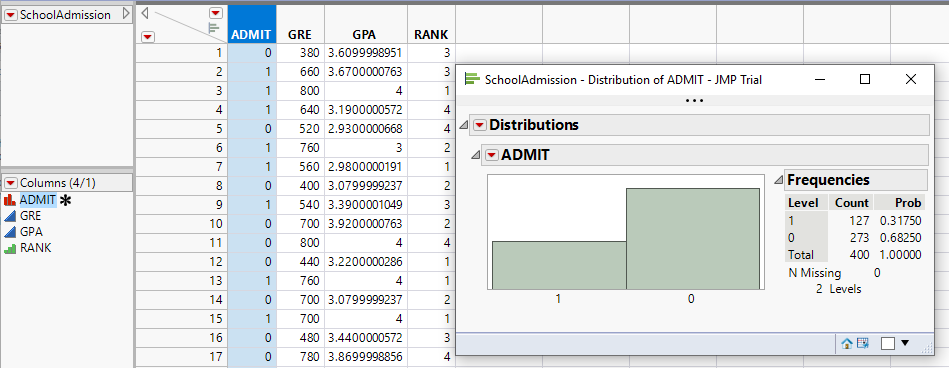
- Since we are interested in understanding ADMITTED students, apply the Value Ordering column property so that 1 (admitted) appears first in graphics and analyses. Show the screenshot to provide the evidence of this step. [2 points]
- Show the distribution of the response “ADMIT” and the relationship between ADMIT and other potential predictor variables [2 point + 3 points]. In two variable displays, make sure you chose different color and symbol for “Admitted” and “not admitted”. Explain the results in a few sentences. [3 points]
- Use Analyze-> Fit Model to perform a stepwise fit for “ADMIT” using all relevant predictors in the data.
- Share the screenshot of stepwise regression results (after clicking Go & using Minimum BIC and Whole Effects). [2 points]
-
- Run the logistic regression model using the selected variables in the previous step. Share the screenshot of the Whole Model Test. Is the model you developed significant for the population? [2 points]
-
- Share the screenshot of the effect summary of the final model to predict, “ADMITTED”. Which variable is most important in predicting, “ADMITTED”? [2 points]
-
- Show the screenshot of the parameter estimates table. Interpret what the results suggest in relation to RANK variable. [2 points]
-
- Share the screenshot of the saved logit function of the model. The formula can be seen when we save the probability formula to the data table (from the red triangle for the model select Save > Save Probability Formula). The resulting logit of the probability model is saved as Linear in the data table. [2 points]
- What should the recruiters say based on this analysis when they are explaining to students about their chance of getting admitted to the program? [5 points]
Expert Answer
You have been tasked to develop a model to predict candidate’s admission to the program that the school could potentially use to develop an aggressive recruitment campaign. The school understands that targeting right students would result in saving money in their marketing endeavor.
Case question:
- Since we’re interested in understanding ADMITTED students, apply the Value Ordering column property so that 1 (admitted) appears first in graphics and analyses. Show the screenshot to provide the evidence of this step. [10 points]
The image below indicates the admit property 1 appearing first in the distribution.
Examine the data, one variable at a time, two variables at a time, and many variables at a time. Show
Buy This Answer $15
-- OR --
Subscribe $20 / Month