Have a Question ?

Expert Answers

Search solutions for your assignments from our database.
We have 20+ millions solutions for question that will help you improve your grades

1

(Solved): Assignment : Professional issues in IT ...


Assignment : Professional issues in IT

Introduction
This assignment requires you to demonstrate knowledge and skills you have acquired throughout the course of this unit by producing a fully referenced, academic report that addresses the tasks given below. In order to complete the assignment, you will need to choose an appropriate IT organisation to research.

Choosing an appropriate organisation (referred to as YourOrg in these notes)
Step 1 : Research global companies that currently exist. The top IT companies are leading innovation in consulting, outsourcing, technology and services across the world. With the growing focus on automation and technology, there has been a consistent boom as far as the IT sector is concerned. Things like cloud computing, privacy, online security etc are the IT services being served to clients by the best software companies in the world. The list of top IT companies include; Infosys, Microsoft, IBM, Oracle, Accenture, HPE, & SAP. The majority of these IT companies operate in US and Asia which contribute to one-third of the overall global business worldwide. You do not necessarily have to include a company that is the top 10 globally.

Step 2 : Research and select an international business within the IT industry to use for this assignment.

Step 3 : Ensure the main activities of your organisation (YourOrg) enable you to:

  • Identify the social, ethical and professional issues identified as essential to the IT profession that have been problems within the organisation (YourOrg) and the standards used to overcome any problems.
  •  Identify a clear project management lifecycle and associated techniques that can be analysed and evaluated
  • Be able to discuss the deployment of a software application, analysing the potential risks and problems that have occurred when a software application has been deployed within YourOrg.
  • Understand risks and the management within an IT project, including risk management techniques and strategies.
  • Give a clear insight into the organisation’s IT Service Management (ITSM) and identify management techniques to achieve the organisations objectives. Identify the ITSM focus and what standards were employed.
  • Identify software quality policies and procedures that exist in the organisation, using software quality management metrics.

Researching YourOrg. You can use web resources to enable you to understand the context in which YourOrg operates. Do not limit yourself, however, to web-based sources of information. You should also use academic, industry and other sources.
Research and make notes on the following:

  • Current information and knowledge of professional issues in IT
  • Current challenges within professional issues in IT

Example: Infosys
Infosys is an Indian Multi National Company that provides IT solution to its client through business process consulting, software development and business process outsourcing services.

Infosys had around 200,000 employees by the end of March 2017 and its headquarters are located in Bengaluru, Karnataka, India. The company is also known for its high gender diversity as it has around 36% of women workforce all across the world.
Infosys was the second largest Indian IT company by 2017 and is ranked as the 10th IT company in the world in terms of revenue.

Out of its total workforce, more than 75% are software professionals, 15-20% are working in its Business process mapping arm and the remaining are engaged in technical support and sales projects. It was India’s first IT company which was able to cross annual revenue of US$100 million in the year 2000, US$1 billion in 2004 and US$10.21 billion in 2017.
The website is www.infosys.com.

Do NOT use Infosys as the YourOrg company for your assignment. This is just an example. You must choose a company yourself.
Once you have chosen a suitable company you would need to check to make sure you can find out about all the different requirements listed in step 3 above.

Assignment notes
You should produce a single 4000 word academic report that covers the questions laid out below. You must also include a 200 word overview of YourOrg and a bibliography/ references section, neither of which are included in your word count.
 

Task 1 – 15 Marks
Ethics within the IT industry is very subjective. Organisations are becoming more aware of the serious impact ethical or unethical behaviour can have, not only internally with their workforce but also externally (e.g. market share, legal ramifications).
You need to be able to identify the social, ethical and professional issues identified as essential to the IT profession that have been problems within (YourOrg) and the standards used to overcome any problems.
Using the lecture notes and any other notes you have studied/researched in this PIIT unit,

  1. Identify the ethical framework that YourOrg uses.
  2. Give a description of their organisational code of ethics, including both the aims and constraints sections.
  3.  Investigate how this is applied internationally for YourOrg.
  4. Explain any standards YourOrg employs in applying their ethical framework.
  5. Produce an alternative ethical framework that you think would work just as well as the one they have in place, or that would be more suitable.


Task 2 – 15 Marks
For every project YourOrg has undertaken there will have been a business case prepared which is all about the organisation making a decision on whether the proposed project is viable. In large projects, the business case is often a 3-part development process which culminates in a Full Business Case. Various plans will have been drawn up e.g. a draft project plan, at this stage.

  1. Identify a large project that YourOrg has undertaken and describe the project.
  2. Using a recognised project management lifecycle model e.g Prince 2, identify how YourOrg’s project you have identified fits into each phase of this lifecycle.
  3. Draw a diagram of this lifecycle identifying those phases that are the most important.
  4. Explain in detail how YourOrg used these phases when they undertook development of this project.


Task 3 – 15 Marks
Software deployment is an overview term within the IT industry to encompass any processes that result in software systems utilisation from beginning to end. A formal software deployment strategy should have been generated before the time of deployment, ideally during the planning approach, that ties both parties to a proactive approach.
ITIL (the Information Technology Infrastructure Library), responsible for many IT related best practise approaches, has released a deployment management framework.

  1. Identify which approach to software deployment that YourOrg has taken.
  2. Explain why it has chosen to deploy its software in this way.
  3. Discuss how YourOrg has approached any problems it encountered.
  4. Outline how they managed the risks commonly associated with software deployment, for example type of release, documentation and training.


Task 4 – 15 Marks
There are many approaches to managing risk within a project that allow you to understand risks, analyse them and how to manage them, including risk management techniques and strategies.

  1. Focus on a particular project that YourOrg has undertaken and describe the project in detail.
  2. Create a detailed Risk Plan for this project. You are expected to apply tools and techniques introduced in the PIIT unit and to include all the phases of the specificapproach you have chosen.
  3. Identify any international standards that have been used.


Task 5 – 15 Marks
IT Service Management (ITSM) is customer focused and as such overlaps with an organisation’s business service management approach. ITSM provides IT services from the perspective of the client and their business needs.

  1. Identify a client to whom YourOrg has provided such a service and provide a detailed description of this service.
  2. Give a clear explanation into YourOrg’s IT Service Management (ITSM) for this client.
  3. Evaluate the management techniques used to achieve the organisations objectives.
  4. Identify the ITSM focus and what international standards and frameworks were employed.


Task 6 – 15 Marks
Software quality definitions vary and one overriding definition is hard to reach. Because of this it is defined in other ways – conformance to requirements and fitness for purpose are two of the most common. For software to be reliable it must fulfil its intended purpose and be measurable (metrics).
Quality factors are the result of industry attempting to measure software quality. Software can be broken down into manageable and measurable ‘quality factors’- both technical and human.

  1. Define the concept of software quality.
  2. Identify the software quality policies and procedures that exist in YourOrg.
  3. Show how software quality is measured using software quality management metrics.
  4. Discuss the advantages/ disadvantages of the method of measuring software quality that YourOrg employs.


Task 7 – 10 Marks LO1
Evaluate the learning that you have undertaken in order to complete this assignment, using the Gibbs reflective cycle (1988) model. Based upon your learning, you should reflect on each element of the model in order to produce an action plan, examining what you would do if this happened again.


Guidance
Consult with your tutor if you are uncertain about any aspect of the assignment.
You should apply theory to YourOrg at all stages. In other words, you must provide
information and knowledge based on what you have researched about the organisation, and analysed through the application of relevant literature. It is not enough to just describe the YourOrg organisation and cite links to a website.
 

Submission requirements

  • The word count for the word-processed report is 4000 words. You must also include a 200 word overview of YourOrg and a bibliography/ references section, neither of which are included in your word count of 4000 words.
  • All references and citations must use the Harvard Style.
  • You must submit a paper copy and digital copy (on CD, USB flash drive or similarly acceptable medium).

View Buy Answer $15 Sign In -- OR --

1

(Solved): Assignment : Computer Networks and Security...


Introduction
The purpose of this assignment is to assess your knowledge of computer networks and security. You should read the following scenario carefully and provide a written response to the FOUR (4) tasks. Where you need to make any assumptions, you should state them clearly in your answer.

Scenario
This scenario refers to Shopping R Us, an SME (Small/Medium Enterprise) located in London, selling various household, healthcare, and grocery products to customers from its store. Due to the rapid expansion of the business, the management has decided to introduce online sales of products. Customers can order items through the company’s new online shopping website and the ordered items are dispatched from the warehouse. Any new customer will need to complete an online registration form. When placing an order, they can pay via a credit or debit card from any major bank.
The online shopping website is hosted on a server running a Linux operating system and used to be maintained by the former network administrator who has since left the company. Since the development of the online shopping website, the company has encountered multiple security incidents which have affected sales and customer service delivery.
The company currently has 50 employees who work both at the store and warehouse. Recently 20 employees have been working from home and it is likely more employees will be working remotely. The employees act as the online primary point of contact for customers, handle stock control, answering the phone and email enquiries, resolving complaints and processing orders in an efficient and timely manner.
The company management is concerned about the continuous network security issues and considers the protection of customer information and other assets a top priority for the business.

Details of the Task
Each task outlines specific network security issues and threats faced by the company. As the new network administrator, you will need to propose network defence solutions and strategies for the company. Your proposed solutions and strategies should help them satisfy all their aims of mitigating network security threats, protecting customer information and ensuring business continuity. Your solutions need to be both technical and specific especially in terms of what tools/ software/ resources/ techniques/ configurations you recommend.

Task 1 (25 Marks)
The online shopping website suffered a Distributed Denial of Service (DDoS) attack which lasted for FOUR (4) hours on one occasion. There are concerns this attack could happen again.

a) Explain in detail what a Distributed Denial of Service (DDoS) attack is and the impact this attack could have on business operations and continuity at Shopping R Us.
(10 marks)

b) Intrusion Prevention Systems (IPS) and Firewalls are examples of network security devices and form part of the Defence-In-Depth strategy.

i) Describe in detail, the purpose and components of an Intrusion Prevention System (IPS) and explain how it can be used to limit Distributed Denial of Service (DDoS) attacks.

ii) Explain, the concept of a defence-in-depth strategy.

iii) Explain which defence-in-depth layers a firewall and IPS can be implemented in.
(15 marks)

Task 2 (25 Marks)
a) The employees at Shopping R Us currently bring and use their personal devices such as laptops, mobile phones, and storage drives on the company’s network. The management is concerned that the use of these devices can introduce network security threats and vulnerabilities to the network. You have been tasked to create and implement a security policy to address this issue.

i) Discuss in detail what a security policy is and explain security threats and vulnerabilities that can be introduced by the employees’ personal devices.

ii) Highlight the specific type of security policy that can be implemented to address the network security threats and concerns. You should describe in detail, the steps you will take to implement this security policy.
(15 marks)

b) Describe the steps you will take when conducting an overview of the security status and security assessment of the operating system running on the online shopping website’s server.
(10 Marks

Task 3 (25 Marks)
a) You have been advised to set up a demilitarized zone (DMZ) using a dual firewall approach for the internet facing website and the internal company network, as shown in Figure 1.


Figure 1. Shopping R Us Demilitarized Zone (DMZ)

i) Explain the purpose and advantages of a Demilitarized Zone (DMZ).

ii) Explain the purpose of a firewall and how the dual firewalls should be configured to protect the company’s internal network.
(10 marks)

b) Employees working from home need to be able to access the internal network remotely over the internet. One of the solutions proposed is that the company should adopt Virtual Private Networks (VPNs).

i) Explain the purpose of VPNs and how a VPN functions.

ii) Describe the appropriate VPN suitable for Shopping R Us and the factors you will consider in selecting this VPN.
(15 marks)


Task 4 (25 Marks)
a) You have been requested to implement access controls so that only authorised customer service employees can have access to information about customers’ payment status, order status, and returns on the online shopping website.

i) Discuss the difference between authorisation and access control.

ii) Describe with justification the appropriate type of access control you will use in the above scenario.
(10 marks)

b) The management is concerned with controlling and regulating the movement of individuals and vehicles in and out of the store and warehouse.

i) Describe access controls that could be implemented to prevent vehicles from moving through unauthorised areas.

ii) Describe access controls that could be implemented to restrict the entry of unauthorised individuals into the warehouse.

iii) Explain how Shopping R Us can enforce controlling and regulating the movement of individuals and vehicles in and out of the store and warehouse.


Guidance
Consult with your tutor if you are uncertain about any aspect of this assignment.


Submission requirements
You must submit a word-processed report.
Your report should answer Tasks 1 to 4. The word count for your report is 4000 words


View Buy Answer $15 Sign In -- OR --

1

(Solved): WPC 300 : Final Exam summer2021 update...


WPC 300: Final Exam

Summer 2021 update

Question 1

2.5 pts

Which of the following techniques is a combination of data, mathematical models, and various business rules?

  • Prescriptive analytics
  • Predictive analytics
  • Explanatory analytics
  • Descriptive analytics

Question 2

2.5

Which of the following is not an important component of data analytics process'

  • Communication
  • Interpretation
  • Team building
  • Discovery

Question 3

is a hypothesis that people value a product more once their property right to it is established

  • Framing effect
  • Overconfidence
  • Endowment effect
  • Clustering illusion

Question 4

2.5 pts

Which of the following analytics technique would 'Costco Corporation' use to find out their likely revenue for next five years?

  • Descriptive analytics
  • Predictive analytics
  • Prescriptive analytics
  • Explanatory analytics

Question 5

Which of the following is true in Heuristics?

  • We value quantitative information and models
  • We learn by analyzing
  • We seek optimal solution
  • We rely on common sense

Question 6

Gambler's fallacy is 

  • A clustering illusion bias
  • A zero risk bias
  • Framing effect bias
  • An endowment effect bias

Question 7

 An over reliant of the first piece of information is a bias from

  • Zero risk effect
  • Bandwagon effect
  • Clustering illusion
  • Anchoring effect

Question 9

Which of the following analytic technique is useful to discover and understand the causal relationship of an outcome?

  • Prescriptive analytics
  • Explanatory analytics
  • Predictive analytics
  • Descriptive analytics

Question 10

Which of the following is NOT considered a drawback for the analytical decision-making

  • Lack of flexibility
  • Delayed action
  • Frustrations in teams
  • Comparison of all alternatives

Question 11


What are the four types of data analytical methods?

  • Descriptive, analytical, predictive and prescriptive
  • Descriptive, explanatory, predictive and prescriptive
  • Descriptive, logical, predictive and prescriptive .
  • Critical, analytical, predictive and explanatory

Question 12

Which of the following is an example of primary data?

  • Internet data
  • Simulated data
  • Firm's proprietary database
  • Interview data

Question 13

2.5 pts

You conducted a survey with 200 randomly selected students from freshman class at ASU to find out the average height of ASU students. What is the 'population' in this example?

  • The 100 selected students
  • All freshman at University of Arizona
  • 1000 freshman students from W.P. Carey school of business
  • All students at ASU.

Question 14 Which of the following statements is true?

  • A/B testing is only done for direct mail campaign.
  • A/B testing is often done in brick and mortar store.
  • A/B testing is only done for website.
  • A/B testing is only done in digital environment.


Question 15

kurtosis for a perfectly normal distribution is

  • 2
  • 0
  • 1
  • -1


Question 16

When two variables are highly positively correlated, the correlation coefficient could be

  • More than 1
  • Close to 0
  • Close to -1
  • Close to 1


Question 17

In a controlled experiment, the subjects in the control group 

  • Are given a placebo
  • Are given a placebo and treatment
  • Are tested for confounding variables
  • Are given the treatment


Question 18

Which is true of A/B testing?

  • It compares two samples of customers to test their behavior
  • It compares two versions of a website to see which one performs better
  • It compares two different versions of non-disclosure agreement to see which one is better
  • It compares two random events to find the best

Question 19

How do blind experiments increase the validity of research results?

  • They allow experimenters to manipulate expectation of participants.
  • They allow the experimenters to control the results of an experiment.
  • They decrease the chance of experimenter and participant biases affecting experimental results
  • They allow for a subjective interpretation of experimental results


Question 20

___________ is an extraneous variable in an observational study that correlates with both dependent and independent variables.

  • Control
  • Confounder
  • Treatment
  • Sample


Question 21

An experiment is said to be double-blinded if ____________

  • A placebo is given to some of the subjects
  • Researchers don't know who is being given the treatment.
  • The research is not aware of confounding variables.
  • Subjects and those working with the subjects are not aware of who given which treatment.


Question 22

The central tendency of a data sample is measured by ____________

  • inferential statistics that identify the best single value for representing a set of data
  • inferential statistics that identify the spread of the scores in a data set
  • descriptive statistics that identify the best single value for representing a set of data
  • descriptive statistics that identify the spread of the score in a data set


Question 23

Mean value for ________ data is computed by summing all values in the data set and (1,nding the sum by the number of values in the data set.

  • Nominal
  • Categorical
  • Any
  • Continuous


Question 24

What is a dependent variable in an experiment?

  • A factor that responds to change made to treatment
  • A factor that researchers can hold constant
  • The factor that researchers typically manipulate during the experiment
  • A condition that may negatively affect the outcome of the experiment


Question 25

One of the assumptions in One-Way ANOVA is _________

  • Equal variance of each population
  • Unequal variances of samples
  • Population means are different
  • Observations are quite dependent


Question 26

A paired sample t-test evaluates if the mean of the difference between two variables is significantly different from ________

  • The variance
  • Each other
  • Zero
  • One


Question 27

The mean and standard deviation of a population is 500 and 50 respectively. The sample sae is 2S. What is the mean value of the sample mean distribution?

  • 8
  • 25
  • 50
  • 500


Question 28

One way ANOVA analysis is useful when

  • You are testing the validity of the sample
  • You are comparing two groups from one sample
  • You are comparing more than two sample means
  • You are comparing one sample mean


Question 29

The figure below is based on a random sample collected to study alcohol contents in a certain drug. What is the standard deviation of the sample?


Question 30 The margin of error in your inference comes from

  • Standard deviation
  • Sample size
  • Sampling error
  • Sample mean

Question 31

2.5 pts

Sample of size 25 is selected from a population with a mean 40 and a standard deviation 5 The standard error of the sample means distribution is:

  • 1
  • 8
  • 40
  • 5

Question 32 All things being equal, the lower the p-value

  • The greater is the chance of rejecting the null hypothesis
  • The smaller is the sampling error
  • The small is the value of population mean
  • The smaller is the chance of rejecting the null hypothesis

Question 33

2.5 pts

You find a statistically significant ANOVA. In order to determine which groups are ditterent,you must conduct a 

  • correlation analysis
  • Tukey's test
  • regression analysis
  • Student's t-test


Question 35

What is the purpose of an inferential statistical test?

  • To see if your results are accurate
  • To randomize the sample
  • To make sure you have not made a mistake in your data collection
  • To check the probability of your results applying to the entire population


Question 36

The null hypothesis in the analysis of variance (ANOVA) asks whether means of

  • any groups are the same
  • all groups are the same
  • specific groups are the same
  • selected groups are the same


Question 37

Which of the following is the first stage of agglomerative hierarchical clustering"

  • By separating cluster into two finer groups
  • By separating two pairs of clusters with minimal Euclidean distance between them
  • By joining two clusters that are closest to each other
  • By joining two clusters farthest away from each other


Question 38

2..5 pts

Which method of analysis does not classify variables as dependent and independent vanab1es?

  • Analysis of variance
  • Linear Regression
  • Logistic regression
  • Cluster analysis

Question 39

After which process in ETL, the data would be ready for in-depth analysis?

  • Data separation
  • Data extraction
  • Data loading
  • Data transformation


Question 40

Clustering is part of data mining.

  • Supervised
  • Predictive
  • Unsupervised
  • Explanatory

Question 41

2.5  

The clustering method uses information on all pairs of distances, not merely the minimum or maximum distances.

  • Average linkage
  • Single linkage
  • Medium linkage
  • Complete linkage


Question 42

Which of the following is not true of cluster analysis?

  • Objects in each cluster tend to be similar to each other and dissimilar to objects in the other clusters.
  • Cluster analysis is a technique for analyzing data when the dependent variable is categorical and the independent variables are categorical in nature.
  • Custer analysis is also called segmentation analysis.
  • Groups or clusters are suggested by the data, not defined a priori.


Question 43

2.5 pts

Which analysis would you perform to segment your customers for a target marketing campaign'?

  • Linear Regression
  • Logistic Regression
  • ANOVA
  • Clustering

Question 44

2.5 pts

In the data transformation process, the ETL tool transforms data in accordance viral _ established by the organization.

  • Standard protocol
  • Business rules and standards
  • Business plan
  • Business model

Question 45

2.5 pts

Which of the following is a definition of distance between two clusters in a single linkage clustering?

  • The average of distance between all pairs of objects, where each pair is made up of one obiect tram each group
  • The distance between the least distant pair of objects, one from each group
  • The sum of square of the distance between clusters
  • The distance between the most distant pair of objects, one from each group

Question 46

2.5 pts

In the data extraction process, ETL tool gathers data primarily from which c` source?

  • Operational systems
  • Online Vendor
  • Hard disk
  • Competition

Question 47 Which of the following is a false statement?

  • Reducing SSE (sum of squared error) within cluster increases cohesion.
  • In the cluster analysis, the objects within clusters should exhibit an high amount of similarity.
  • The k-means algorithm is a method for doing partitional clustering.
  • To predict sales from transactional data one should perform clustering analysis.

Question 48

2.5 pts

is a clustering procedure characterized by the development of a dendrogram.

  • Hierarchical clustering
  • Divisive clustering
  • k-Means clustering
  • Classification technique

Question 49 In classification problems, the primary source for accuracy estimation is

  • R-squared
  • Slope  
  • Confusion matrix
  • Correlation coefficient

Question 50

To make sure that the multi-collinearity is not an issue in your regression model, the measured variance inflation factor should be 

  • Equal to 20
  • Equal to 0
  • More than 20
  • Less than 5


Question 51

For a hypothesis testing with correlation, the null hypothesis is:

  • Correlation coefficient is -1
  • Correlation coefficient is 1
  • Alternative hypothesis is not true
  • Correlation coefficient is 0


Question 52

Which of the following is true about multicollinearity?

  • The effect of a dependent variable on another becomes difficult to isolate.
  • It is best measured using the statistical variance inflation factor (VIF)
  • P-value reduces significantly leading to rejection of the null hypothesis.
  • Regression coefficients become clearer and are easier to interpret.


Question 53

 In regression analysis, one uses data _______

    • From an independent variable to predict he dependent variable
    • From an extreme value to predict outlier
    • From any variables to predict any other variable
    • From an dependent variable to predict an independent variable


Question 54

Correlation coefficients between dependent and independent variables cannot be

  • -1.0
  • 5.6
  • Zero
  • 0.56


Question 56

The lowest value of coefficient of determination is   0

Question 57

Highest value of correlation coefficient is   1

2.5

Question 58

Classification analysis can be done using.  

  • Multiple linear regression
  • Logistic regression
  • Non-linear regression
  • Linear regression


Question 60

For the best line fit diagram (shown below), which of the following statement is not true?

Question 61 When is a data table' a better way to show insights than a chart?

  • With large sample data (n=1000)
  • With large sample data (n=1000) and 10 different data variables.
  • With small sample data (n=10) and 1000 data variables.
  • With small sample data (n=10) with a couple of data variables


Question 62

2.5 pts

When you are expecting a correlation between sales and profit as shown in the graph below. what kind of visualization is this?

Question 63

2.5 pls

Which of the following statements describes one of the basic principles for creating a good chart. defined by Edward Tufte?

  • The chart should display grid for easy reading
  • The chart should tell a story
  • The chart should apply additional visual effects so it will stand out,
  • The chart should have a lot of ink

Question 66

Visualization of spatial data are most illustrative when shown using

  • Bar graph
  • Maps
  • Bubble graphs
  • Line graphs

Question 68

Which are useful principles for data visualization?

  • The use of a wide range of colors is critical to emphasize distinctions
  • It is important to include every possible information in a chart
  • Including as many grids as possible is vital for fully specifying the data to be represented
  • The chart should yield insights beyond text

Question 69

2.5 pts

Which of the following charts should not be used to display the total sales by the salesperson when it is evaluated from a data-ink perspective?

  • A 2-D bar chart
  • A 3-D bar chart
  • A line chart
  • A 2-D horizontal bar chart

Question 70

Which of the following statements is a reason not to use a table?

  • Tables cannot easily show trends
  • Large amount of information can be included in a very small space
  • The table has more precise numbers
  • Tables display more information in less space than a chart

Question 71

 A set of data that describes about data in relational database is called

  • Semi-structured data
  • Structured data
  • Metadata
  • Unstructured data

Question 72

2.5 pts

When you access information from two different tables connected by an identifier key, the SQL keyword you should use is 

  • COUNT
  • ORDER BY
  • GROUP BY
  • INNER JOIN

Question 73

 The following are among the 4V's of big data except

  • Vitality
  • Velocity
  • Volume
  • Veracity

Question 74

In a database table for 'Product', the information about a single product resides in a single

  • Table
  • Field
  • Row
  • Entity

Question 75

Results can be sorted in a database using SQL statement.

  • SELECT
  • WHERE
  • ORDER BY
  • FROM

Question 76

Which SQL statement is used to extract data from a relational database?

  • OPEN
  • SELECT
  • EXTRACT
  • GET

Question 77

Which of the following is not an on-demand computing service obtained over the network?

  • Software as a service
  • Consulting service
  • Infrastructure as a service
  • Platform as a service

Question 78

 NoSQL is primarily designed for

  • Improve data integrity
  • Big data
  • Structured data
  • Data that cannot be stored in flat files[u1] 

Question 79

What does the acronym "SaaS" stand for?

  • Software as a Service
  • Storage as a Service
  • Software as application service
  • None of the other answers is true

Question 80

2.5 pts

What type of values you should use when creating a primary key column of a database table?

  • Values that contain meaningful information
  • Same value for each record
  • Unique values for every record
  • Values that are null



 [u1]


View Buy Answer $15 Sign In -- OR --

1

(Solved): WPC 300 Quiz 7: Data/information architecture...


WPC300

Quiz 7  Data/information architecture

  • Points 20
  • Questions 10

Attempt History

Question 1

2 / 2 pts

You are creating a database to store temperature and wind data from various airport. Which of the following fields is the most likely candidate to use as the basis for a Primary Key in the Airport Table?

  •   City
  •   AddressCorrect!
  •   Airport code 
  •   State

Question 2

2 / 2 pts

Which of the following is not a component of relational database?

  •   Relationship among rows in tables
  •   Metadata 
  •   Tablesorrect!
  •   CPU of Database Server 

Question 3

2 / 2 pts

Which of the following is true focus of Information Architecture?Correct!

  •   Making all information easy to find
  •   Make only irrelevant information easy to find
  •   Deliver information to the client where there is a misunderstanding
  •   Make the information hard to find 

Question 4

2 / 2 pts

The SQL code to extract only departure time information for all records of the following "Flight" table is:

  •   SELECT * FROM Flight;
  •   SELECT Flight # FROM Departs;rrect!
  •   SELECT Departs FROM Flight;
  •   SELECT * FROM Flight WHERE To = "LGA (New York City)";

Question 5

2 / 2 pts

Which of the following tools help in periodic managerial decision-making?

  •   Database Correct!
  •   OLAP
  •   Servers 
  •   OLTP

Question 6

2 / 2 pts

When you access information from two different tables connected by an identifier key, the SQL keyword you should use is ____________.

  •   COUNT
  •   ORDER BY
  •   GROUP BY orrect!
  •   INNER JOIN

Question 7

2 / 2 pts

Which of the following is a cloud service provider?

Correct!

  •   VMWare 
  •   Dropbox
  •   iCloud 
  •   Gmail

Question 8

2 / 2 pts

Which of the following is an important task of a database management system?

  •   Provides unauthorized access to data when authentication fails
  •   Provides support such as performing maintenance and routine backups.ounswered
  •   Helps create rules for data analysis
  •   Helps collect data from vendors

Question 9

2 / 2 pts

When are asked to design a database for airline ticket reservation system, based on an Entity Relationship Data model, which of the following could be an example of "entity"?

  •   Arrival time
  •   Destination cityCorrect!
  •   Traveler
  •   Flight Number

Question 10

2 / 2 pts

Which of the following is not a traditional data architectural process?Correct!

  •   Visual 
  •   Physical 
  •   Conceptual
  •   Logical


View Buy Answer $15 Sign In -- OR --

1

(Solved): WPC 300 : SAS Assignment 1 Solutions...


WPC 300

SAS Assignment 1 Solutions


a. Create a new diagram named Organics.

1) Select File ðNew ðDiagram. The Create New Diagram window appears.
2) Enter Organics in the Diagram Name field.


3) Click OK.

b. Define the data set AAEM.ORGANICS as a data source for the project.

1) Set the model roles for the analysis variables.
2) Examine the distribution of the target variable. What is the proportion of individuals who purchased
organic products?

a) Select File ðNew ðData Source. The Data Source Wizard window appears.
b) Click Next. The wizard proceeds to Step 2.
c) Enter AAEM.ORGANICS in the Table field.
d) Click Next. The wizard proceeds to Step 3.


e) Click Next. The wizard proceeds to Step 4.


f) Select the Advanced radio button and click Customize. The Advanced Advisor Options window
appears.
g) Enter 2 as the Class Levels Count Threshold value.


h) Click OK. The Advanced Advisor Options window closes and you are returned to Step 4 of the
Data Source Wizard.
i) Click Next. The wizard proceeds to Step 5.
! By customizing the Advanced Metadata Advisor, most of the roles and levels are correctly
set.
j) Select Role ðRejected for TargetAmt.


k) Select TargetBuy and select Explore. The Explore window appears.


l) Close the Explore window.


3) The variable DemClusterGroup contains collapsed levels of the variable DemCluster. Presume that,
based on previous experience, you believe that DemClusterGroup is sufficient for this type of modeling
effort. Set the model role for DemCluster to Rejected.
This is already done using the Advanced Metadata Advisor. Otherwise, select RoleðRejected for
DemCluster.

4) As noted above, only TargetBuy is used for this analysis, and should have a role of Target. Can
TargetAmt be used as an input for a model used to predict TargetBuy? Why or why not?

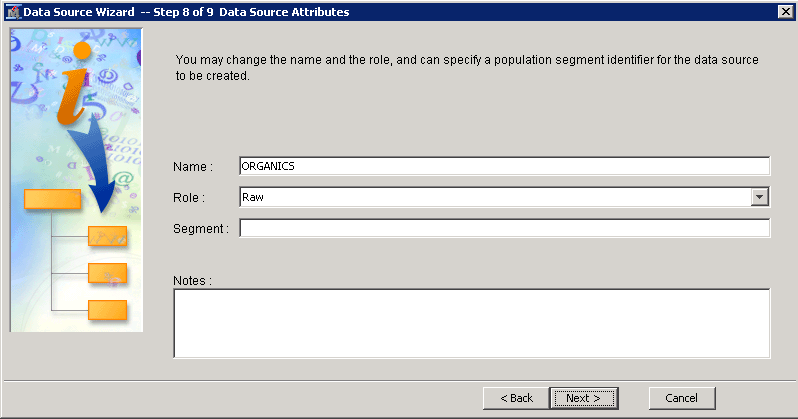
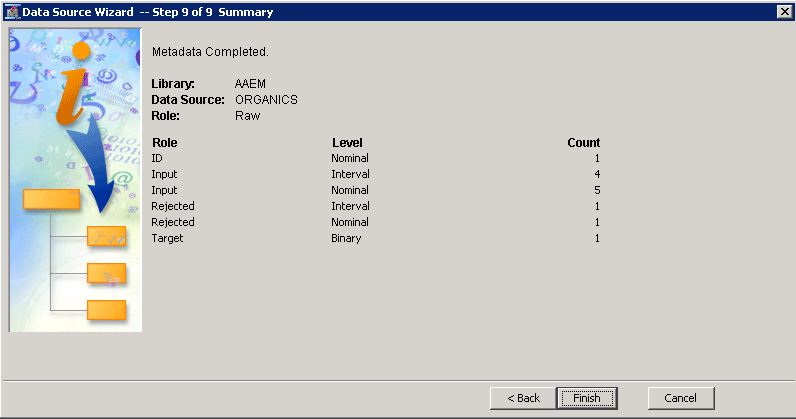
5) Finish the Organics data source definition.

a) Click Next. The wizard proceeds to Step 6. No decision processing is required.


b) Click Next to proceed to the sample data window. No sample data is created.
c) Click Next. Leave the role of the table set to Raw.


d) Click Next.


e) Click Finish. The wizard closes and the Organics data source is ready for use in the Project Panel.

c. Add the AAEM.ORGANICS data source to the Organics diagram workspace.
d. Add a Data Partition node to the diagram and connect it to the Data Source node. Assign 50% of the
data for training and 50% for validation.


1) Enter50 as the Training and Validation values under Data Set Allocations.
2) Enter 0 as the Test value.


e. Add a Decision Tree node to the workspace and connect it to the Data Partition node.


f. Create a decision tree model autonomously. Use average square error as the model assessment statistic.

• Select Average Square Error as the Assessment Measure property.


• Right-click the Decision Tree node and click Run from the Option menu.
• Click Yes in the Confirmation window.


1) How many leaves are in the optimal tree?


a) When the Decision Tree node run finishes, select Results from the Run Status window. The
Results window appears.


The easiest way to determine the number of leaves in your tree is via the Subtree Assessment plot.
b) Select View ðModel ðSubtree Assessment Plot from the Result window menu. The Iteration
Plot window appears.


Using average square error as the assessment measure results in a tree with 29 leaves.


2) Which variable was used for the first split? What were the competing splits for this first split?


! These questions are best answered using interactive training.
a) Close the Results window for the Decision Tree model.


b) Select (interactive ellipsis) from the Decision Tree node's Properties panel.


The SAS Enterprise Miner Interactive Decision Tree window appears.


c) Right-click the root node and select Split Node from the Option menu. The Split Node 1
window appears with information that answers the two questions.


g. Add a second Decision Tree node to the diagram and connect it to the Data Partition node.

1) In the Properties panel of the new Decision Tree node, change the maximum number of branches
from a node to 3 to enable three-way splits.


2) Create a decision tree model again. Use average square error as the model assessment statistic.
3) How many leaves are in the optimal tree?


h. Based on average square error, which of the decision tree models appears to be better?
1) Select the first Decision Tree node.
2) Right-click and select Results from the Option menu. The Results window appears.
3) Examine the Average Squared Error row of the Fit Statistics window.


4) Close the Results window.
5) Repeat the process for the Decision Tree (2) model.


View Buy Answer $15 Sign In -- OR --

1

(Solved): WPC300 Practice Test (Practical) - Score for this attempt: 2...


WPC300
Practice Test (Practical) 
JUNE 2021 UPDATE

Score for this attempt: 20 out of 20

Instructions
PRACTICE Practical Exam Instructions
This exam has a total of two sections. You are required to use two sets of data to answer all the questions. Please see the individual instructions for each section. The total time allowed for this exam is 75 minutes. You must complete the exam in one seating. You will need JMP Pro and Excel software to analyze data and answer questions. 
Note: You are expected to work individually to complete this exam before the due date. Getting help from outside resources other than what is made available to you via the canvas course site is considered a violation of the code of academic integrity for which you will be liable for the consequence. 

Score for this attempt: 20 out of 20
 Data background

The sample includes various demographic and blood test responses for 442 diabetes patients (respondents). The response variable Y is a quantitative measure of disease progression one year after baseline measurements were taken. The ten variables measured at baseline time are age, gender (1 = male, 2 = female), body mass index (BMI), average blood pressure (BP), and six blood serum measurements (Total Cholesterol, LDL, HDL, TCH, LTG, & Glucose). The response Y Binary is constructed from the response Y and defined as high if Y is above 200 or low otherwise.

Section A:
Instructions: 
•    Use the following data file for this section: SampleDiabetes.xlsx  
•    Remember the honor code.
•    Use Excel to prepare your responses to the questions in this section
•    Note that sometimes numbers have been rounded.
Create a new column using a vlookup() function to categorize the age variable into age categories as follows:

Age    Category
70+    1
60-69    2
50-59    3
40-49    4
30-39    5
19-29    6
 
Question 1
1 / 1 pts
Using a pivot table, determine which of the following statements is incorrect.
•       Category 4 has 97 respondents Correct!
•       Category 3 has 54 respondents
•       Category 5 has 73 respondents
•       Category 2 has 90 respondents

Question 2
1 / 1 pts
Using a pivot table, determine which of the following statements is incorrect about the average age of respondents in each age category.
•       Category 3 average age is 54.0 years
•       Category 2 average age is 63.8 years
•       Category 4 average age is 44.9 years!
•       Category 1 average age is 71.2 years

Question 3
1 / 1 pts
Create a pivot table pie chart for people of age 40 or older using the same age categories as before, determine which of the following statements is correct.
•       Category 3 has 28% of the respondents
•       Category 2 has 20% of the respondentst!
•       Category 2 has 28% of the respondents
•       Category 4 has 22% of the respondents

Section B
Instructions

•    Use the following JMP data file for this section [Diabetes.JMP]
•    Remember the honor code.
•    Use JMP Pro to prepare your responses to the questions in this section
•    Note that sometimes numbers have been rounded.
 

Question 4
1 / 1 pts
Which of the following statements is not correct based on the sample data provided?
•       The mean for LDL is 115
•       The upper limit of the 95% confidence interval for BP is 95.9
•       The median for Total Cholesterol is 186
•       The standard deviation for HDL is 0.6152

Question 5
1 / 1 pts
Looking at the distribution of BMI, you observe that the data centrality is measured as:
•       n = 442 
•       Standard Error = 0.21
•       Standard deviation = 4.41orrect!
•       Mean = 26.4

Question 6
1/ 1 pts
Looking at the distribution of Glucose, you observe that the distribution spread is measured as:Answered
•       Mean is 91.3
•       95% confidence interval is 90.2 to 92.3
•       Standard error is 11.5
•       Interquartile range is 15

Question 7
1 / 1 pts
It is generally believed that the average population age is 50. You claim that the population average age is less than 50. Perform a statistical test on the sample to see if the average age for the sample is consistent with your hypothesis (use a margin of error of 5%). What is the p-value from the test?
•       0.05Correct!
•       0.0089 
•       0.9911 
•       0.0179

 Question 8
1/ 1 pts
It is generally believed that the average population age is 50. You claim that the population average age is more than 50. Perform a statistical test on the sample to see if the average age for the sample is consistent with your hypothesis (use a margin of error of 5%). What can you conclude?
•       We fail to reject the null hypothesis
•       We accept the null hypothesis
•       We do not have enough information to make a judgement on the null hypothesisAnswered
•       We reject the null hypothesis

Question 9
1 / 1 pts
Perform a pairwise correlation analysis of the variables Y, age, BMI, BP, Total Cholesterol, LDL, HDL, TCH, LTG, & Glucose in the sample suggests that:
•       The population has a significant negative correlation between TCH and Total Cholesterol
•       The population has no correlation between Total Cholesterol and LDLt!
•       The population has a significant negative correlation between HDL and TCH
•       The population has a significant negative correlation between Y and BMI

Question 10
1 / 1 pts
If we are interested in determining a possible cause and effect relationship where BMI and Age are causing disease progression (Y), _____ is the independent variable and ____ is the dependent variable?
•       Age, BMI respectivelyAnswered
•       BMI, Y respectively
•       BMI, Age respectively
•       Y, BMI respectively

Question 11
1 / 1 pts
Perform a simple linear regression to predict Y using respondents’ BMI. What is the correct equation for the regression line?
•       Y = 10.2*BMI
•       BMI = -118 + 10.2*YCorrect!
•       Y = -118 + 10.2*BMI
•       BMI = 21 + 0.034*Y

Question 12
1 / 1 pts
Perform a multiple regression analysis (with a margin of error of 5%) that examines all of the variables in the sample (excluding Y binary) as potential predictors of Y. Which of the following conclusions can be made based on the analysis without removing any of the predictor variables?
•       LDL is a significant predictor in the model, LTG is not.
•       TCH is a significant predictor in the model, Glucose is not.Correct!
•       BMI is a significant predictor in the model, HDL is not.
•       Age is a significant predictor in the model, Total Cholesterol is not.

Question 13
1 / 1 pts
After performing model building by applying backward deletion to the model described in Q12, which of the following conclusions is valid based on the final model?
•       Glucose is not a significant predictor, but Gender is
•       Total Cholesterol is not a significant predictor, but BP isYou Answered
•       HDL is not a significant predictor, but LTG is
•       Age is not a significant predictor, but LDL is

Question 14
1/ 1 pts
Based on the final model developed in Q13, which is the strongest predictor in the model?
•       Intercept
•       BMIou Answered
•       Total Cholesterol 
•       Gender

Question 15
1 / 1 pts
Based on the final model developed in Q13, which is the weakest predictor in the model?ct!
•       Gender
•       Total Cholesterol
•       Intercept
•       BMI

Question 16
1 / 1 pts
How much of the variation in the dependent variable can be explained by the final regression model developed in Q13?
•       50.8%You Answered
•       51.5%
•       <.0001
•       We cannot determine this quantity

Question 17
1 / 1 pts
Is there a multicollinearity concern for the final model developed in Q13?
•       There is a multicollinearity problem in the final model and we should delete the LTG variableCorrect!
•       There is a multicollinearity problem in the final model and we should delete the Total Cholesterol variable
•       There is no multicollinearity problem in the final model
•       There is a multicollinearity problem in the final model and we should delete the Gender variable

Question 18
1 / 1 pts
The Y Binary variable was developed to categorize respondents into high and low development of Diabetes over the year since their baseline measurements were taken. What proportion of high development respondents are female? Answered
•       75.3%
•       69.6%
•       24.7%
•       30.4%

Question 19
1 / 1 pts
In an initial logistic regression analysis attempting to establish if all of the variables (excluding Y) in the sample can predict (with a margin of error of 5%) the level (high/low) of the disease, it can be concluded that:u Answered
•       Some of the predictors are not significant and can be deleted from the model
•       The overall model is significant in predicting the level of development of the disease
•       The model accuracy can be determined by the confusion matrix
•       All the other answer choices are correct

Question 20
1 / 1 pts
In the final logistic regression model to predict/classify Y binary, which of the following statements is true:
•       77 respondents were correctly classified by the model as high disease development
•       291 respondent were correctly classified by the model as low disease development
•       44 respondents were incorrectly classified by the model as low disease developmentCorrect!
•       All of the other answer choices are correct


View Buy Answer $15 Sign In -- OR --

1

(Solved): WPC 300 : Practical Exam Summer 2021 insights...


Practical Exam

Quiz Instructions

Practical Exam Instructions (already distributed). You must read the instructions carefully before starting the practical exam.

This exam has a total of four sections. You are required to use four sets of data to answer all the questions. Please see the individual instructions for each section. The total time allowed for this exam is 100 minutes. You must complete the exam in one seating. You will need JMP Pro and Excel software to analyze data and answer questions. 

Note: This is an open book/note exam. You are expected to work individually to complete this exam before the due date. Remember the honor code.   


Note: this is a timed quiz. You may check the remaining time you have at any point while taking the quiz by pressing the keyboard combination SHIFT, ALT, and T... Again: SHIFT, ALT, and T...

Top of Form


SECTION A:

Instructions:

  • Use the following data file for this section
  • Remember the honor code.
  • This section is worth a total of 37.5 points. 
  • In addition to responding to multiple-choice questions, you need to submit an updated data file with your name appended to the front of the filename (e.g. firstname_lastname_filename). 
  • Create 2 new columns as follows:
    • The first new column shows the outcome when you calculate the total score for a school as a combination of 'critical reading mean' + 'mathematics mean' + 'writing mean'.
    • The second column will use a vlookup() function to segment the performance of a school according to the data outlined in the Table. Make sure you correctly implement this table on your excel file first before using them on a vlookup(). 

Total score

Performance

0-1099

D

1100-1199

C

1200-1399

B

1400+

A


Question 118 pts

Create a pivot table on a new sheet to calculate how many schools were in each performance category. Show the outcome in both a table and a pie chart.

Screenshot of the 2 new columns (1 screenful is enough), pivot table output, and pie chart output (3 x 6 points).

Create a word document (that you will upload here) and paste those screenshot in sequence as follows:

1. Two-column output. 

2. Pivot Table output

3.  pie chart output

Upload 


Question 2           6 pts

What is the average (with 0 decimal places) across all schools for the total score?

Group of answer choices

  • 1221
  • 1287
  • 1229
  • 1215

 Question 3          6 pts

Which performance category has the least number of schools?

Group of answer choices

  • C
  • D
  • A
  • B


Question 4           6 pts

How many schools were in the C category?

Group of answer choices

  • 116
  • 143
  • 150
  • 160


Question 5           6 pts

What is the average SAT score for performance category B (0 decimal places)?

Group of answer choices

  • 1268
  • 1271
  • 1256
  • 1282

Question 6           8 pts

Add your name to the Excel filename (as the first part of the filename) and submit the completed file that you used to answer the above questions.

Upload 


SECTION B

Instructions:

  • Use the following data file for this section.
  • Remember the honor code.
  • This section is worth a total of 37.5 points.  Must use JMP Pro to complete the analysis and respond to the questions in this section. 
  • In addition to responding to multiple-choice questions, you need to submit an updated data file with your name appended to the front of the filename (e.g. firstname_lastname_filename). 
  • For this dataset, create a new column 'Total SAT Score' which is a combination of 'critical reading mean' + 'mathematics mean' + 'writing means'.


Question 7           6 pts

What is the 95% confidence interval for the population mean of the total SAT score? 

Group of answer choices

  • 1109.00 & 1259.25
  • 1197.37 & 1232. 38
  • 1747.42 & 1968.25
  • -1 & 1

 Question 8                    6 pts

It is generally believed that the mean value of the district's total  SAT score distribution is equal to 1200 (the null hypothesis). The principal from one of the schools claims that the mean value of the district's total  SAT score distribution is not 1200. Perform the appropriate test with a 5% margin of error. What is the corresponding p-value?

Group of answer choices

  • 0.0478
  • 0.9522
  • 0.0956
  • 0.0324


Question 9           6 pts

Take a screenshot of the results you obtained after performing the test with a 5% margin of error (as instructed in Q8). Make sure your name is visible in the screenshot. Upload the screenshot here.

Upload 


Question 10        6 pts

Based on the test, what can we conclude about the district’s total SAT mean score?

Group of answer choices

  • We fail to reject the null hypothesis
  • We do not have enough information to make a judgement on the null hypothesis
  • We reject the null hypothesis
  • We accept the null hypothesis


Question 11        6 pts

If the null hypothesis for the district mean score is that the mean total SAT score is below 1220, what would you conclude from your statistical test (with an alpha level of 5%)? 

Group of answer choices

  • We accept the null hypothesis
  • We reject the null hypothesis
  • We do not have enough information to make a judgement on the null hypothesis
  • We fail to reject the null hypothesis


Question 12        6 pts

Which category of SAT test has the least average score across the schools in the sample data file. 

Group of answer choices

  • Critical reading
  • We do not have enough information to make a conclusion
  • Writing
  • Mathematics

Question 13        6 pts

What is the standard error (with 1 decimal place) across all schools for the total SAT score?

Group of answer choices

  • 1170.0
  • 1214.9
  • 174.9
  • 8.9


Question 14        8 pts

Add your name to the JMP filename (as the first part of the filename) and submit the completed file with the saved scripts that you used to answer Q11, Q12, & Q13

Upload 

SECTION C

Instructions:

  • Use the following data file for this section:
  • Remember the honor code.
  • This section is worth a total of 37.5 points.  Must use JMP Pro to complete the analysis and respond to the questions in this section. 
  • In addition to responding to multiple-choice questions, you need to submit an updated data file with your name appended to the front of the filename (e.g. firstname_lastname_filename). 
  • For each action that you are asked to do, ensure that you save the script for that action.

Question: The local school district is wondering if there is a difference among the 3 categories of the SAT test, critical reading, writing & mathematics. In particular, if the mean scores of each category of SAT test are different. 


Question 15        6 pts

What kind of statistical test would you perform to answer this question?

Group of answer choices

ANOVA

Z-test

T-test

Regression


Question 16        6 pts

Perform an appropriate analysis to answer the following question. 

What is the 95% confidence interval for the mean score (rounded up to the first decimal place)  in the writing category?

Group of answer choices

406.9 – 419.0

398.3 – 410.2

391.9 – 403.5

403.5 – 409.9


Question 17        6 pts

Based on the appropriate statistical test, do you believe that mean SAT scores are different for different categories of tests (with a 5% margin of error)? Which of the following statements is true?

Group of answer choices

  • You could not conclude anything
  • You reject the null hypothesis and confirm at least one of the means is different from the other
  • You reject the null hypothesis and confirm that the means are same
  • You could not reject the null hypothesis


Question 18        6 pts

Provide a screenshot of the box plots, and results from oneway ANOVA test.

Upload 


Question 19        6 pts

Which value (from the one way ANOVA test) would you use to either reject or not reject a null hypothesis? 

Group of answer choices

  • Root Mean Square error in “Summary of Fit” table
  • Adjusted R^2 in “Summary of fit” table
  • p-value in the “Analysis of Variance” table
  • Mean square value in the “Analysis of Variance” table

Question 20        6 pts

Which of the following tables from a statistical analysis helps you learn if the mean SAT score of one category is significantly different from the other two categories?

Group of answer choices

  • Means for one-way ANOVA
  • Summary of fit
  • Connecting Letter Reports
  • Analysis of Variance

 Question 21       6 pts

Based on the interpretation of the analysis, identify which categories of mean SAT scores are significantly different. 

Group of answer choices

  • Mathematics is significantly different from Critical reading
  • Mathematics, Critical Reading and Writing are all significantly different from each other.
  • Writing is significantly different from Critical Reading
  • Mathematics is significantly different from Writing

 Question 22       8 pts

Add your name to the JMP filename (as the first part of the filename) and submit the completed file, including scripts for all of your actions in this section.

Upload 


SECTION D

Instructions:

  • Use the following data file for this section
  • Remember the honor code.
  • This section is worth a total of 37.5 points.  Must use JMP Pro to complete the analysis and respond to the questions in this section. 
  • In addition to responding to multiple-choice questions, you need to submit an updated data file with your name appended to the front of the filename (e.g. firstname_lastname_filename). 
  • For each action that you are asked to do, ensure that you save the script for that action.

Question: The loan manager would like to construct a statistical model to understand which one or more of the provided variables influence the amount of the loan requested. This information would help the bank to target those types of customers to promote their products such as a line of credit offer.  


Question 23        6 pts

What kind of statistical test would you perform to answer this question?

Group of answer choices

  • Simple logistic regression
  • T-test
  • ANOVA
  • Multiple linear regression

Question 24        6 pts

What would be an example of a dependent and an independent variable respectively in this case?

Group of answer choices

  • ‘Applicant Income’ and ‘Loan Amount’
  • ‘Applicant Income’ and ‘Loan Status’
  • 'Loan Amount’ and ‘Applicant Income’
  • ‘Loan Status’ and ‘Credit history’

 Question 25       6 pts

Perform a multivariate correlation analysis using all the continuous variables in the data.

What is the correlation coefficient between ‘loan amount’ and ‘loan amount term’?

Group of answer choices

  • 0.039
  • -0.030
  • 0.17 0
  • 0.551

 Question 26       6 pts

Based on a standard least square regression analysis (assuming 5% margin of error) which of the following variables are significantly influencing the variable ‘Loan Amount’ in loan application process?

Group of answer choices

  • Education, Co-applicant income, and Applicant’s income
  • Credit history, Education and Property area
  • Credit history, Education and Loan Amount term
  • Education, Co-applicant income, and Loan Status


Question 27        6 pts

Based on your final regression model, which of the following variables have the least significant influence in predicting ‘Loan Amount’ in bank loan applications.

Group of answer choices

  • Co-applicant income
  • Loan Amount Term
  • Education
  • Married 

Question 28        6 pts

In your final regression model, what is the value for the coefficient of determination?

Group of answer choices

  • 47.10
  • 0.38
  • 0.66
  • 0.29


Question 29         6 pts

What is the regression equation for the final model? Get a screenshot of the full regression equation and upload it here.

Upload 

Choose a File

 Question 30       8 pts

Add your name to the JMP filename (as the first part of the filename) and submit the completed file, including scripts for all of your actions in this section.

Bottom of Form


View Buy Answer $15 Sign In -- OR --

1

(Solved): CIS 375 Software Lab #5 ...


Software Lab #5 

Instructions

**Purpose: To learn about various Model Comparison tools that are based on the model prediction type using SAS Enterprise Miner application**

Question 1

1 / 1 pts

Separate Sampling is the under-representation of “non-responders” in a training dataset. Which of the following is NOT a synonym for it? 

  •   Choice-based sampling orrect!
  •   Case-based sampling
  •   Balanced sampling
  •   Oversampling

Question 2

1 / 1 pts

Which of the following Fit Statistics should be selected for comparison if the models’ prediction type is to make a binary classification of its cases/instances (i.e. “Decisions”)?

  •   ROC Index 
  •   Average Squared Error (ASR)Correct!
  •   Misclassification
  •   Logit

Question 3

1 / 1 pts

The SAS term for the AUC (Area Under the Curve) is _____________ . 

  •   ROC Scoreorrect!
  •   ROC Index
  •   ROC Area
  •   None of the above

Question 4

1 / 1 pts

In the real-world, model developers often use several model performance tools (graphical and/or numerical) to choose a best model.rrect!

  •   True
  •   False


View Buy Answer $15 Sign In -- OR --

1

(Solved): CSE205 Quiz 5: Inheritance and Polymorphism ...


CSE205

Quiz 5: Inheritance and Polymorphism 


Question 1

1 / 1 pts

T/F? - Private properties are not inherited into a child class.ou Answered

  •   True
  •   False

Question 2

1 / 1 pts

Sometimes inheritance is unnecessary and you should just create a well written Interface instead.  

Note: we're talking of Interfaces like Comparable and such, not the "public interface" Correct!

  •   True
  •   False

Question 3

1 / 1 pts

What is true about the protected keyword in terms of inheritance?t!

  •  Protected items are accessible within the scope of child classes but inaccessible outside to outside scope.

Correct!

  •  If you don't use protected, you have to rely on the public interface of the parent class to access/use parent functionality


  •   Protected members of a class have extra security built in via the compiler.

Correct!

  •  Shockingly ... protected properties and methods are accessible within the scope of anything that shares the package of the class.

This is actually true ... free point ... I forgot to mention this in lecture because I often don't use packages in my sample code for the sake of time.  This is a Java feature.

  •   Protected members are inaccessible in child classes, we use private to make them accessible.

Question 4

1 / 1 pts

Which of these are an example of polymorphism in the real-world?

  • Automobiles

Different cars, while having the same interface can have very different implementations

  •   Different colors of houses!
  •  Smart phones 
  •  Radio stations that play different music/formats

This would actually be one class ... only the content really changes.

  •   The streets in a city 

Question 5

1 / 1 pts

If I want a parent that creates a consistent, reliable set of methods for an inheritance hierarchy, which technique should I use?

  •   Create and use an Interface
  •   Keep parent methods private so that children must provide their own public interface
  •   Provide multiple definitions of the same method to customize functionalityCorrect!
  •   Create an abstract base class with several methods that are abstract

Question 6

1 / 1 pts

In Java, which keyword do we use to create a method that has no body that exists only to be overridden by a child?

  •   virtual
  •   finalCorrect!
  •   abstract 
  •   None of these 
  •   interface

Question 7

1 / 1 pts

Given a class Animal has a child Cat and a child BigCat.  Cat has a child class Tabby and BigCat has a child class Tiger.

Given the code:

Animal animal;

Cat kitty = new Cat();

BigCat big = new BigCat();

Tiger tig = new Tiger();

Tabby tab = new Tabby();

Will this code produce an error?

kitty = null;

  •   yesorrect!
  •   no 

Question 8

1 / 1 pts

Given a class Animal has a child Cat and a child BigCat.  Cat has a child class Tabby and BigCat has a child class Tiger.

Given the code:

Animal animal;

Cat kitty = new Cat();

BigCat big = new BigCat();

Tiger tig = new Tiger();

Tabby tab = new Tabby();

Will this code produce an error?

animal = big;orrect!

  •   no 
  •   yes

Question 9

1 / 1 pts

Given a class Animal has a child Cat and a child BigCat.  Cat has a child class Tabby and BigCat has a child class Tiger.

Given the code:

Animal animal;

Cat kitty = new Cat();

BigCat big = new BigCat();

Tiger tig = new Tiger();

Tabby tab = new Tabby();

Will this code produce an error?

big = tig;

  •   yesCorrect!
  •   no

Question 10

1 / 1 pts

Given this code:

Animal myDog = new Dog(“Spot”);

myDog.speak();

What do we know about the Dog class and the Animal class?

  •   Animal is derived from Dogorrect!
  •   Dog is derived from Animal and Speak() is a method from the parent class that Dog over-rides 
  •   We can tell nothing from this particular code.  We don't see any definitions.
  •   Dog is actually an Interface for animal allowing an Animal to become a Dog.


Question 11

1 / 1 pts

Given a class Animal has a child Cat and a child BigCat.  Cat has a child class Tabby and BigCat has a child class Tiger.

Given the code:

Animal animal;

Cat kitty = new Cat();

BigCat big = new BigCat();

Tiger tig = new Tiger();

Tabby tab = new Tabby();

Will this code produce an error?

big = tab;


Correct!

  •   yes 
  •   no


View Buy Answer $15 Sign In -- OR --

1

(Solved): CSE205 Quiz 4 - Encapsulation  ...


CSE205

Quiz 4 - Encapsulation  

 Question 1

1 / 1 pts

Which is the best/most complete definition of encapsulation?

  •   Encapsulation is used to control how one may access and interact with an object of a class.  Data and internal helper methods are hidden in the back-end of the class, and a public interface is developed to provide controlled access and functionality.
  •   Encapsulation is the process of developing the properties and methods of a class. 
  •   Encapsulation is used to control how one may access and interact with an object of a class.  Data is accessed through getters and setters.
  •   It describes the idea of bundling data and methods that work on that data within a class.

Question 2

1 / 1 pts

Determine the best description of the qualities of getters & setters:orrect!

  •   They allow us to "black-box" access to properties in an object.  Users don't need to know how the data is being stored, they just need a public interface to work with relevant data.  This mentality can also control read & write access and allow us an opportunity to defend against invalid data.
  •   They allow us to indirectly access properties in an object
  •   They allow us to control how properties are stored in a class and who can read and write the data.
  •   Getters and Setters provide read-only or write-only or read/write access to the data stored in the class.  While they are short and seem trivial this is actually a very powerful tool at our disposal.  Direct access to properties invites all sorts of issues and side-effect, similar to using global variables.  Our data is less secure when we don't use getters and setters.

Question 3

1 / 1 pts

T/F? - Proper use of Encapsulation helps enhance our data security.rrect!

  •   True
  •   False 

 Question 4

1 / 1 pts

How do we achieve Encapsulation?orrect!

  •   Proper use of Access/Visibility Modifiers 
  •   Using only private properties
  •   Use of the abstract keyword
  •   Through the use of inheritence

Question 5

1 / 1 pts

At face value this class seems ok ... but really it's not... select all that are true

public class Student

{

        private PersonalInfo information;


        public PersonalInfo getInfo()

        {

                 return this.information;

        }

}

  •   We should decompose PersonalInfo and store the contents directly into student.  There's no point in having a "has a" relationshiporrect!
  •   Returning the PersonalInfo reference can open this Student to direct manipulation of their data. A more robust public interface should be created to protect and control access to PersonalInfo information.
  •   This is just a standard getter ... nothing wrong with that.
  •   This is technically encapsulated properly, but could have very negative consequences.

 Question 6

1 / 1 pts

Tell me about this code...

public class Test

{

        private int positiveNum;


        public void SetNumber(int value)

        {

                 if(value >= 0)

                         this.positiveNum = value;

                 else

                         throw new IllegalArgumentException("Value can't be negative!");

        }

}

Correct!

  •   This code maintains encapsulation
  •   This code breaks encapsulation 
  •   code is vulnerable 
  •   This code does not work/would not compile

Question 7

1 / 1 pts

Match the visibility modifiers to their best description

Correct!

private


Correct!

protected


Correct!

public


Correct!

default (Java)


View Buy Answer $15 Sign In -- OR --

Showing Page 5 of 154 Pages